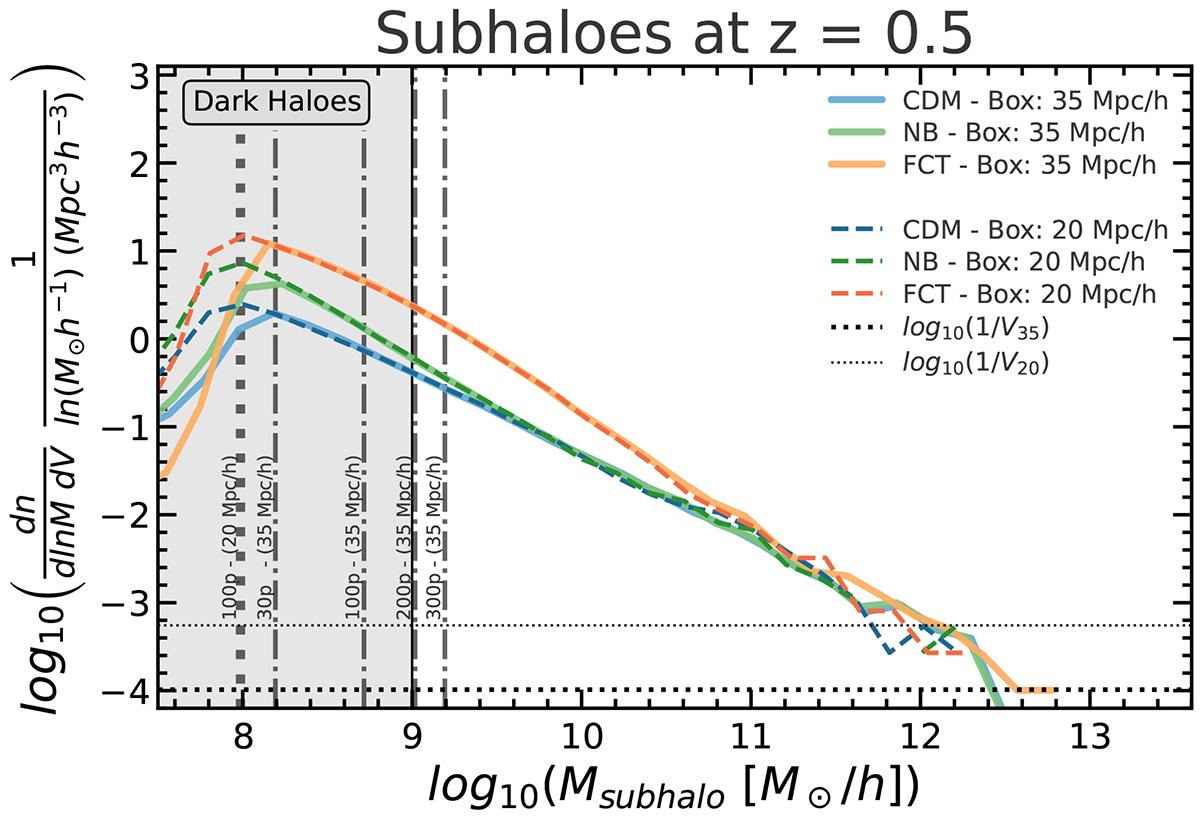
Fig. 4.
Download original image
Subhalo mass functions at z = 0.5 as a function of subhalo mass. Colors and line styles follow the same coding as in Figure 3, with solid lines for 35 Mpc/h simulations and dashed lines for the higher-resolution 20 Mpc/h runs. Particle number thresholds in the 35 Mpc/h boxes are varied to illustrate the impact of resolution cuts on the subhalo mass function estimates.
Current usage metrics show cumulative count of Article Views (full-text article views including HTML views, PDF and ePub downloads, according to the available data) and Abstracts Views on Vision4Press platform.
Data correspond to usage on the plateform after 2015. The current usage metrics is available 48-96 hours after online publication and is updated daily on week days.
Initial download of the metrics may take a while.