Fig. 5.
Download original image
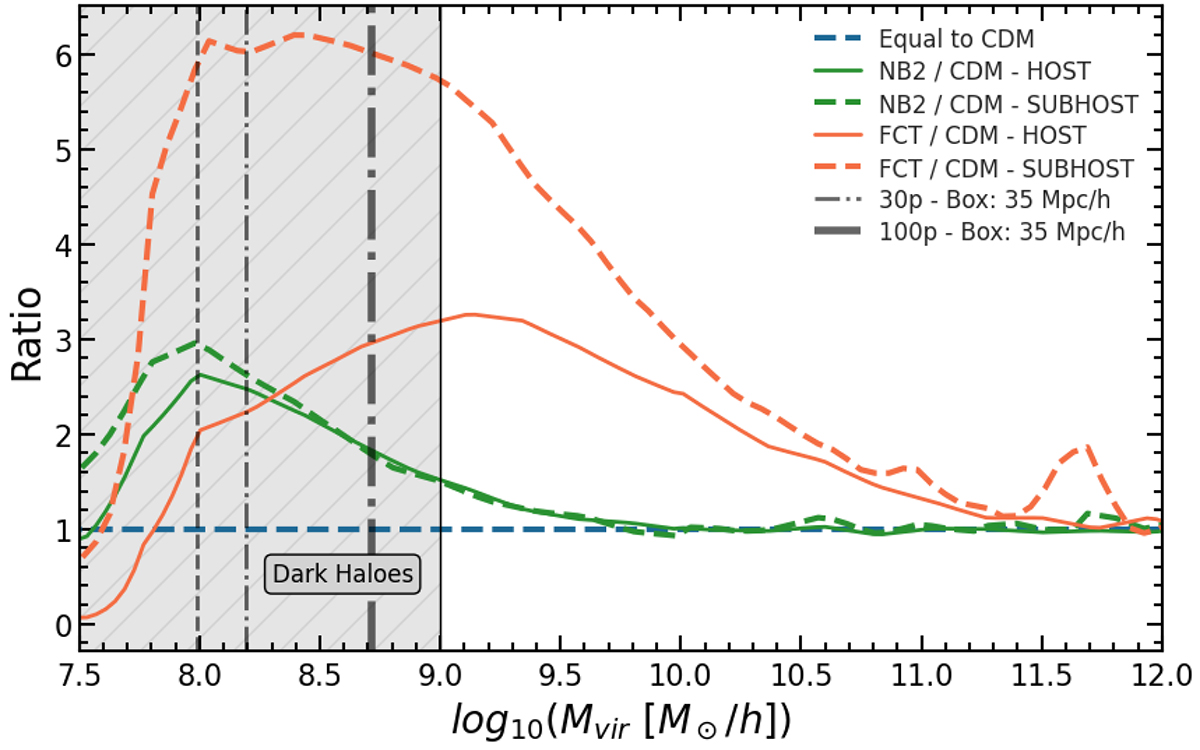
Ratio of subhalo (dashed lines) and halo (solid lines) abundances for the NB (green) and FCT (orange) models relative to the CDM baseline, shown as a function of mass. The blue horizontal line marks perfect agreement with CDM. Each curve combines results from simulations with different box sizes (see text for details). A clear excess near 108 M⊙ in both NB and FCT models suggests a potentially detectable signal via strong lensing. The grey vertical line indicates the resolution threshold. Notably, subhaloes show larger deviations than haloes, which may enhance detectability in lensing analyses.
Current usage metrics show cumulative count of Article Views (full-text article views including HTML views, PDF and ePub downloads, according to the available data) and Abstracts Views on Vision4Press platform.
Data correspond to usage on the plateform after 2015. The current usage metrics is available 48-96 hours after online publication and is updated daily on week days.
Initial download of the metrics may take a while.