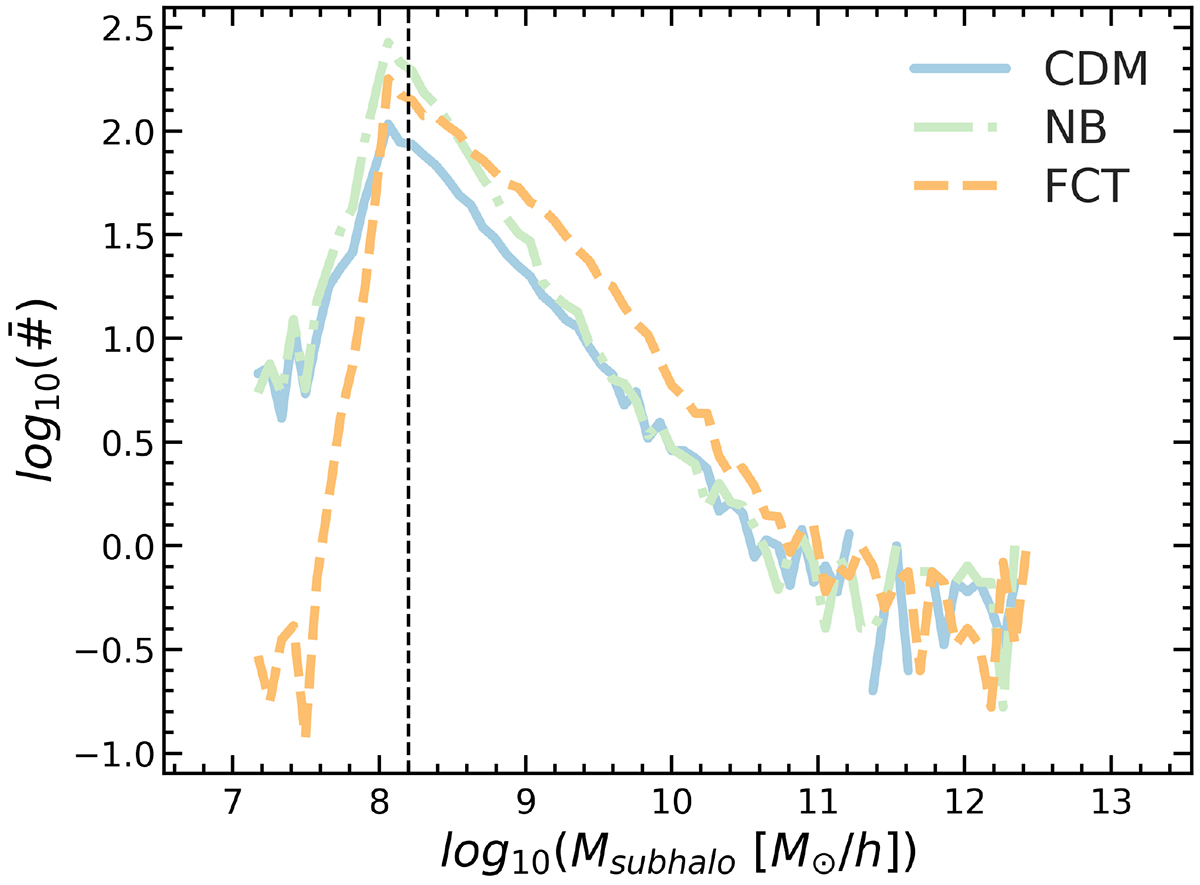
Fig. 6.
Download original image
Mean subhalo mass distribution (with equal arbitrary normalisation across the different models) computed from the 17 most massive haloes in the simulation set. The black dashed line marks the resolution limit adopted throughout the analysis (as defined in Figure 3). The three models – CDM (blue), NB (green), and FCT (orange) – show distinct behaviours. The FCT model exhibits a clear excess in the abundance of low mass subhaloes (Mvir < 109 M⊙), while at intermediate masses, the NB model overtakes the FCT model. This crossover region provides a potential discriminant between scenarios involving enhanced primordial power (NB) and those that also include PBHs (FCT). See text for further discussion.
Current usage metrics show cumulative count of Article Views (full-text article views including HTML views, PDF and ePub downloads, according to the available data) and Abstracts Views on Vision4Press platform.
Data correspond to usage on the plateform after 2015. The current usage metrics is available 48-96 hours after online publication and is updated daily on week days.
Initial download of the metrics may take a while.