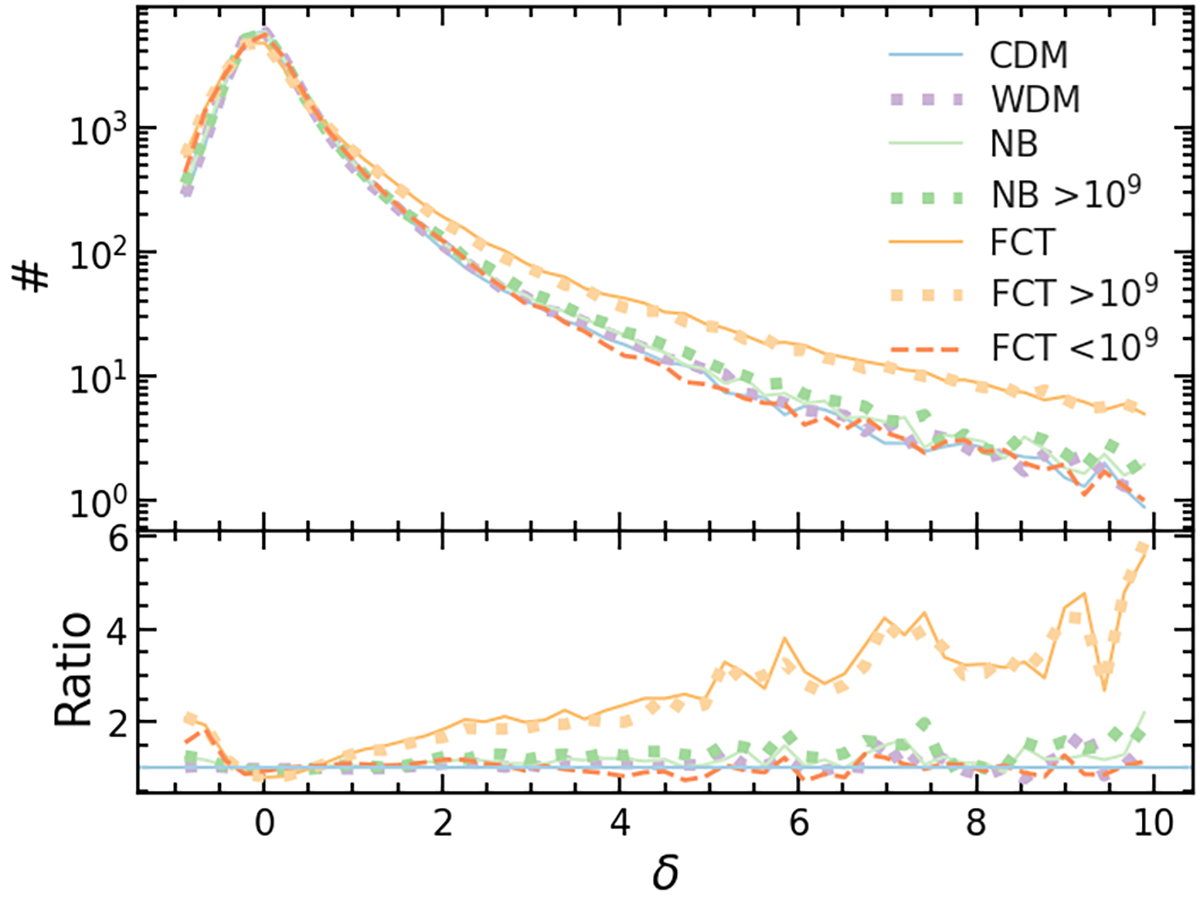
Fig. 8.
Download original image
Stacked δ distribution for the 17 most massive haloes, each analysed across three independent projections. The upper panel shows the normalised count of δ values, while the lower panel displays the ratio of each model relative to the CDM baseline. The FCT model, particularly when including only subhaloes with Mh > 109 M⊙ (FCT > 109), exhibits a clear excess at high δ values compared to other models. This result supports the potential for detecting PBH-induced substructure through brightness fluctuations.
Current usage metrics show cumulative count of Article Views (full-text article views including HTML views, PDF and ePub downloads, according to the available data) and Abstracts Views on Vision4Press platform.
Data correspond to usage on the plateform after 2015. The current usage metrics is available 48-96 hours after online publication and is updated daily on week days.
Initial download of the metrics may take a while.