Fig. C.2
Download original image
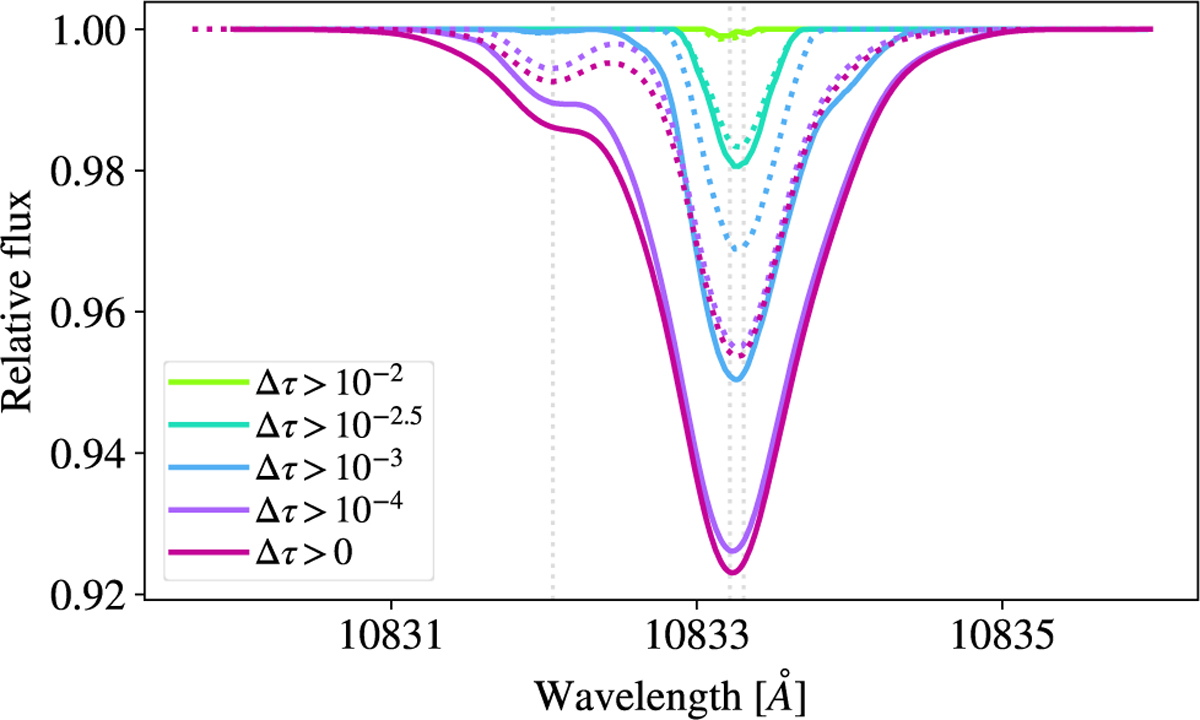
Helium spectra computed using the new (dotted lines) and previous (solid lines) RT codes. Only simulation cells exceeding a specified optical depth threshold in the metastable helium component (Δτ) are included. From green to pink, lines progressively incorporate more cells with lower Δτ values. The two codes produce nearly identical spectra when only high-opacity (high-density) cells are included, but begin to diverge as increasingly low-opacity cells are added. The pink line corresponds to the full spectrum shown at the top of Figure C.1. Light gray vertical dotted lines indicate the nominal wavelengths of the He I 10 833 Å triplet.
Current usage metrics show cumulative count of Article Views (full-text article views including HTML views, PDF and ePub downloads, according to the available data) and Abstracts Views on Vision4Press platform.
Data correspond to usage on the plateform after 2015. The current usage metrics is available 48-96 hours after online publication and is updated daily on week days.
Initial download of the metrics may take a while.