Fig. 3
Download original image
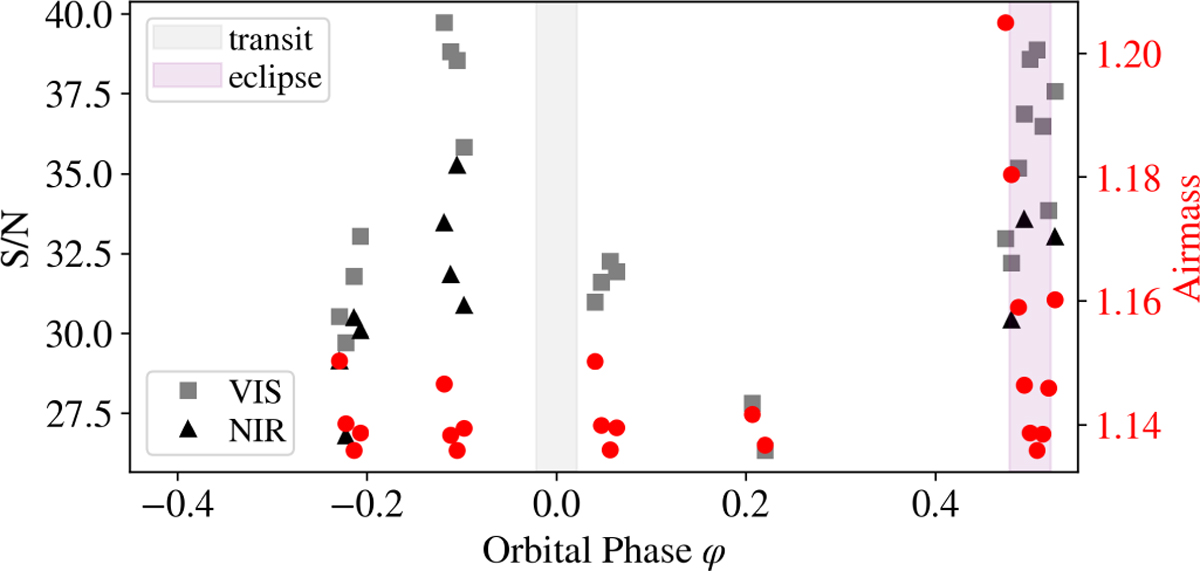
Air mass and signal-to-noise ratios of the CARMENES observations (combined spectra). Black triangles indicate the S/N in the region of the helium triplet (10 820.0 Å < λ < 10 870.1 Å), while the gray squares represent the S/N in the region of the H I 6565 Å line (6550.0 Å < λ < 6580.0 Å). The red dots show the air mass during the observation.
Current usage metrics show cumulative count of Article Views (full-text article views including HTML views, PDF and ePub downloads, according to the available data) and Abstracts Views on Vision4Press platform.
Data correspond to usage on the plateform after 2015. The current usage metrics is available 48-96 hours after online publication and is updated daily on week days.
Initial download of the metrics may take a while.