Fig. 5
Download original image
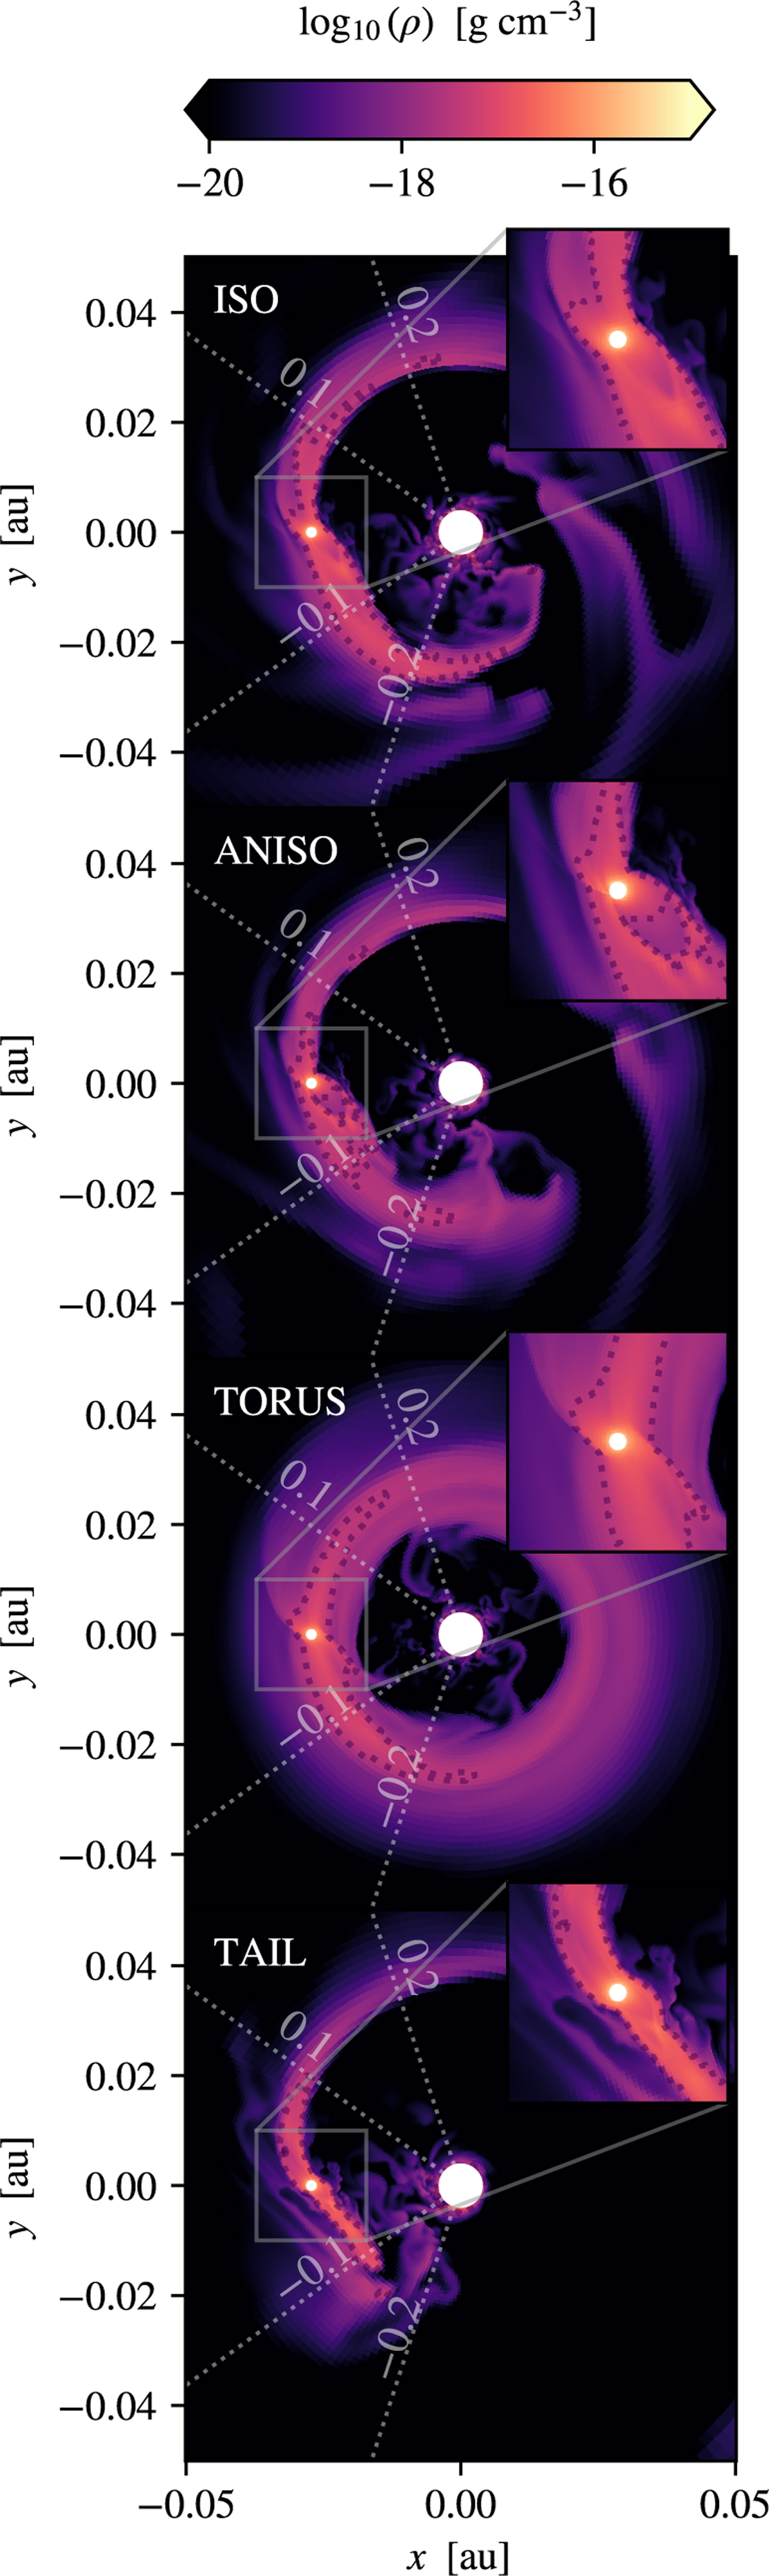
Density distribution of the planetary wind in the orbital mid-plane from the Athena++ 3D hydrodynamic simulations. The star is located at the center, with the planet on the left orbiting in the counter-clockwise direction. The diagonal dotted lines represent the observing angles of various orbital phases φ. The dark dotted contours indicate surfaces with densities of ρ = 1 × 10⁻¹⁸ g cm−3.
Current usage metrics show cumulative count of Article Views (full-text article views including HTML views, PDF and ePub downloads, according to the available data) and Abstracts Views on Vision4Press platform.
Data correspond to usage on the plateform after 2015. The current usage metrics is available 48-96 hours after online publication and is updated daily on week days.
Initial download of the metrics may take a while.