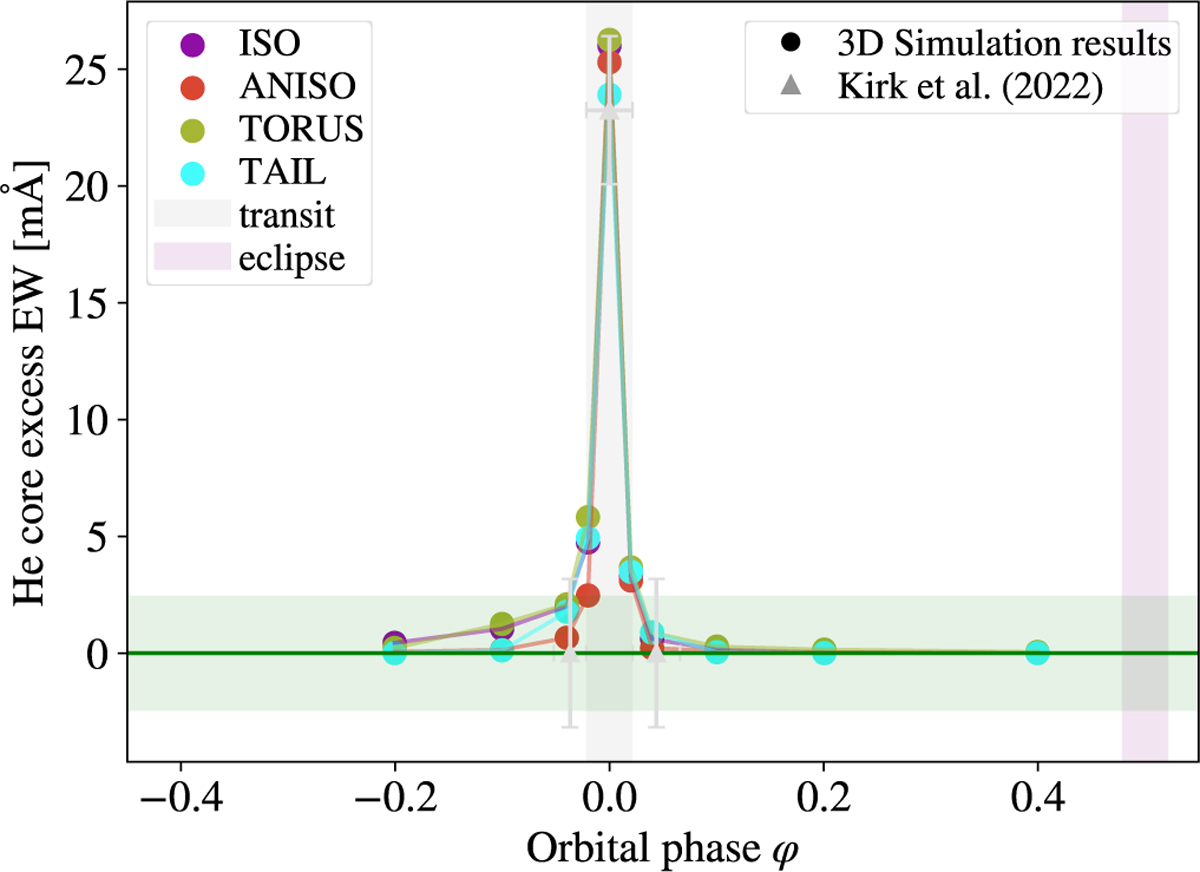
Fig. 6
Download original image
Excess absorption in the helium line core derived from synthetic simulation spectra. EWs were calculated by integrating the flux over the interval λ = [10 832.9, 10 833.62] Å, consistent with the observational methodology described in Section 2. The green region represents the observational results from this study, while the gray points indicate the Keck/NIRSPEC data reported by Kirk et al. (2022) for comparison.
Current usage metrics show cumulative count of Article Views (full-text article views including HTML views, PDF and ePub downloads, according to the available data) and Abstracts Views on Vision4Press platform.
Data correspond to usage on the plateform after 2015. The current usage metrics is available 48-96 hours after online publication and is updated daily on week days.
Initial download of the metrics may take a while.