Fig. 2.
Download original image
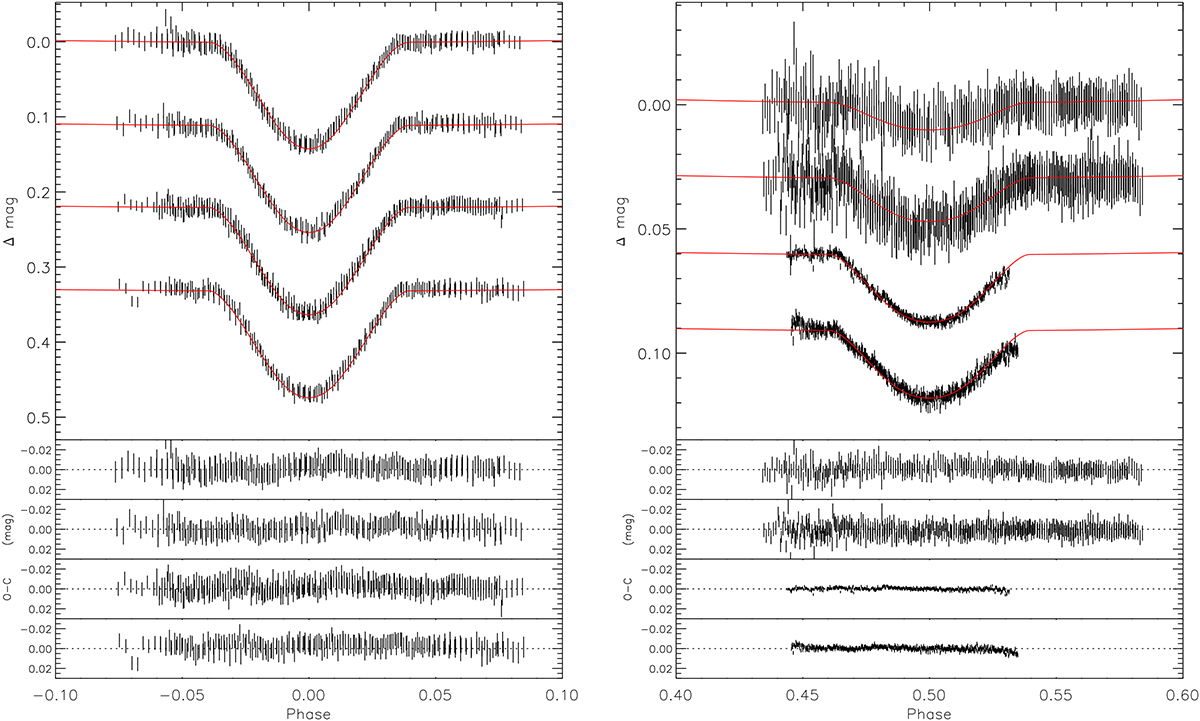
Primary- and secondary-eclipse light curves of MML 48. Left: Primary-eclipse light curves acquired at CTIO/SMARTS-0.9m telescope in BVRI bands (from top to bottom), each shifted vertically for clarity. Overplotted is the PHOEBE best fit model in the corresponding filter, shown by the continuous red line. The photometric uncertainties are represented by the length of the vertical lines. The residuals to the fit are shown in the bottom panels for each band. Right: Secondary-eclipse light curves acquired in the RI bands at the CTIO/SMARTS-0.9m (top two), and the FTS z′-band light curves (bottom two). The light curves are plotted on a different scale between the right and left panels.
Current usage metrics show cumulative count of Article Views (full-text article views including HTML views, PDF and ePub downloads, according to the available data) and Abstracts Views on Vision4Press platform.
Data correspond to usage on the plateform after 2015. The current usage metrics is available 48-96 hours after online publication and is updated daily on week days.
Initial download of the metrics may take a while.