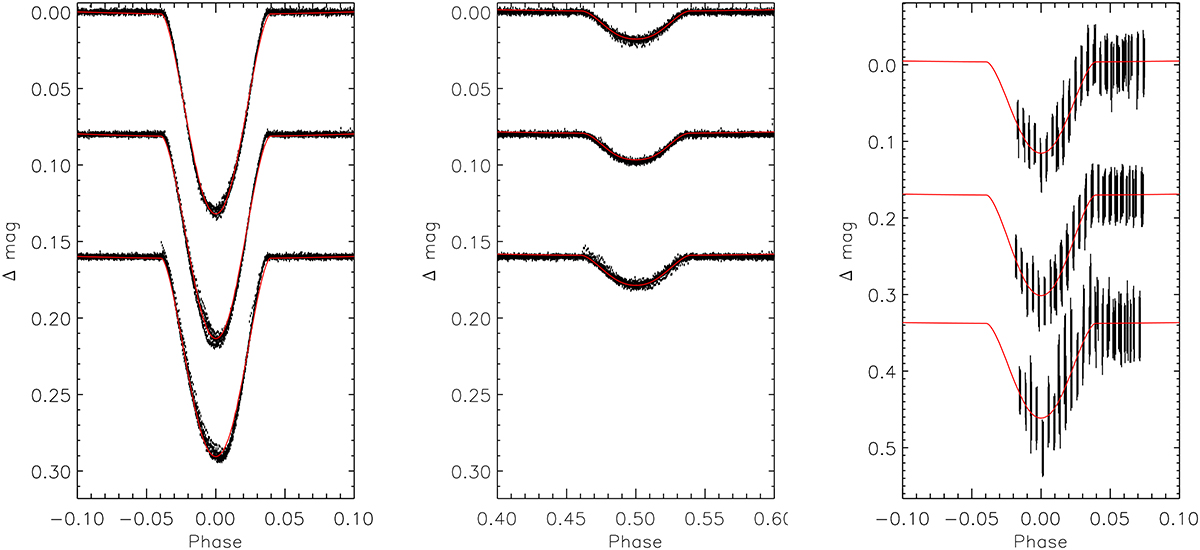
Fig. 4.
Download original image
TESS and CASLEO eclipse light curves of MML 48 compared to best fit model. Left: Primary-eclipse TESS light curve acquired during Sectors 11 (top), 38 (middle), and 65 (bottom). Overplotted is the PHOEBE best fit model in the I-band filter with a third light contamination (of 0.077 in units of total light for Sector 11, 0.064 for 38, and 0.091 for 65), and it is shown by the continuous red line. The individual data point photometric uncertainties are represented by the length of the vertical lines. Center: Secondary-eclipse TESS light curve compared to the best fit model. The TESS light curves are plotted on the same scale for comparison. Right: CASLEO light curves in VRI passbands (from top to bottom) of the MML 48 primary eclipse.
Current usage metrics show cumulative count of Article Views (full-text article views including HTML views, PDF and ePub downloads, according to the available data) and Abstracts Views on Vision4Press platform.
Data correspond to usage on the plateform after 2015. The current usage metrics is available 48-96 hours after online publication and is updated daily on week days.
Initial download of the metrics may take a while.