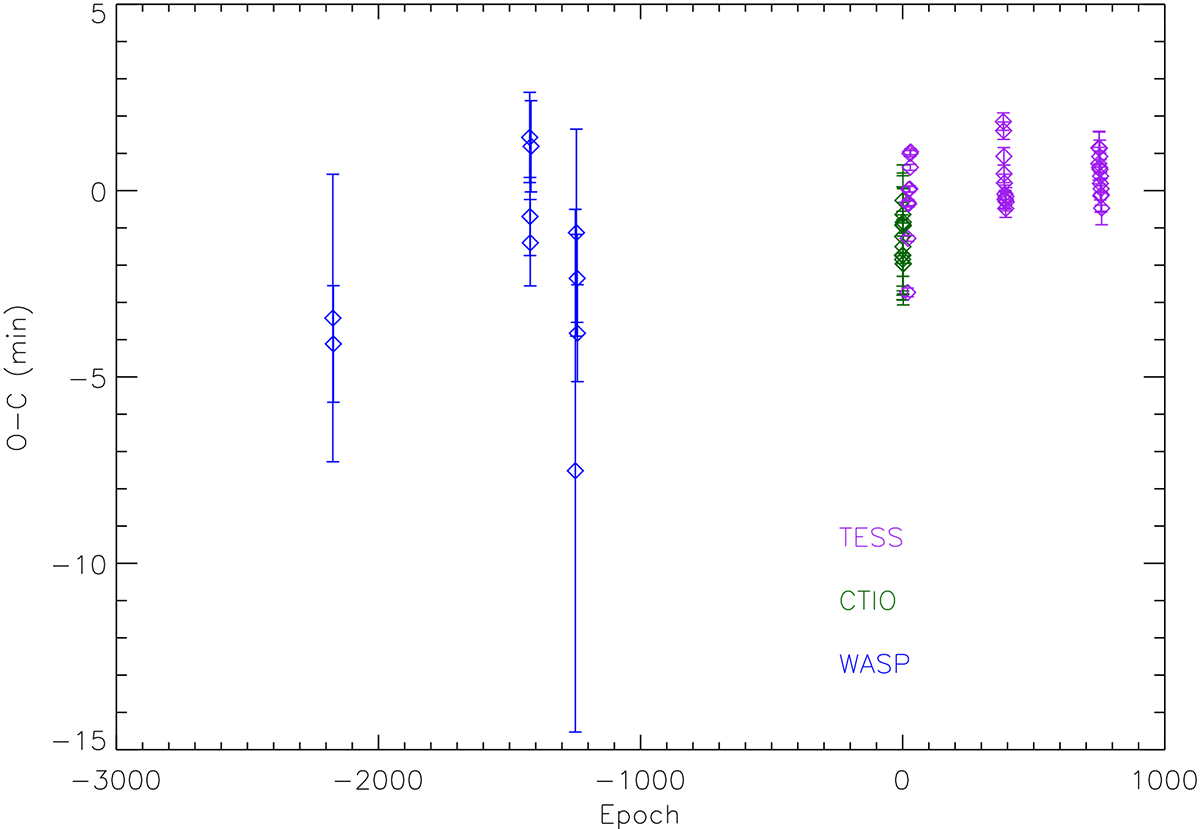
Fig. 5.
Download original image
O–C diagram for all full primary eclipses spanning from 2007 to 2023. The O–Cs were calculated on the measured time of minimum for each primary eclipse where both sides of the out-of-eclipse data are available (Table 3) and the ephemeris derived from the highest precision data as described in Sect. 3.1. The WASP primary eclipses are shown in blue, the CTIO primary eclipses are shown in green, and the TESS primary eclipses are shown in purple. There is no observed trend in the O–C diagram, and all the data are consistent within their uncertainties with the derived linear ephemeris. It must be noted that there is a spread of a few minutes in the individual epoch measurements from a single season that we attribute to spots and that caused the initial uncertainty in the period determination.
Current usage metrics show cumulative count of Article Views (full-text article views including HTML views, PDF and ePub downloads, according to the available data) and Abstracts Views on Vision4Press platform.
Data correspond to usage on the plateform after 2015. The current usage metrics is available 48-96 hours after online publication and is updated daily on week days.
Initial download of the metrics may take a while.