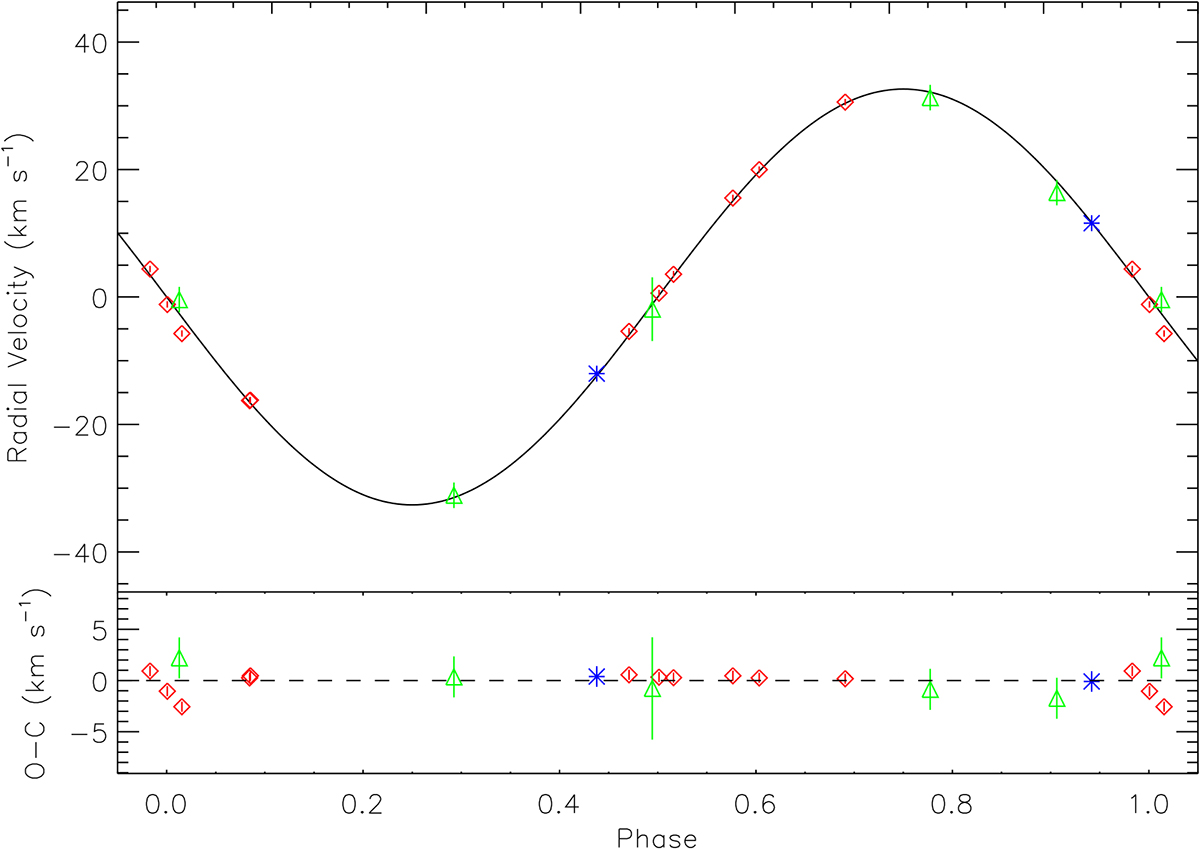
Fig. 6.
Download original image
Relative RV curve for MML 48. Top panel: We present the three RV datasets CHIRON (red diamonds), FEROS (blue asterisks), and SOAR (green triangles). Each dataset has been shifted by the corresponding systemic velocity (reported in Table 4). Overplotted with a solid black line is the model RV curve fit to all three datasets, as described in Sect. 3.3. Bottom panel: Residuals to RV model shown above for all RV measurements. The errors of the individual RV measurements are shown and may be smaller than the data point.
Current usage metrics show cumulative count of Article Views (full-text article views including HTML views, PDF and ePub downloads, according to the available data) and Abstracts Views on Vision4Press platform.
Data correspond to usage on the plateform after 2015. The current usage metrics is available 48-96 hours after online publication and is updated daily on week days.
Initial download of the metrics may take a while.