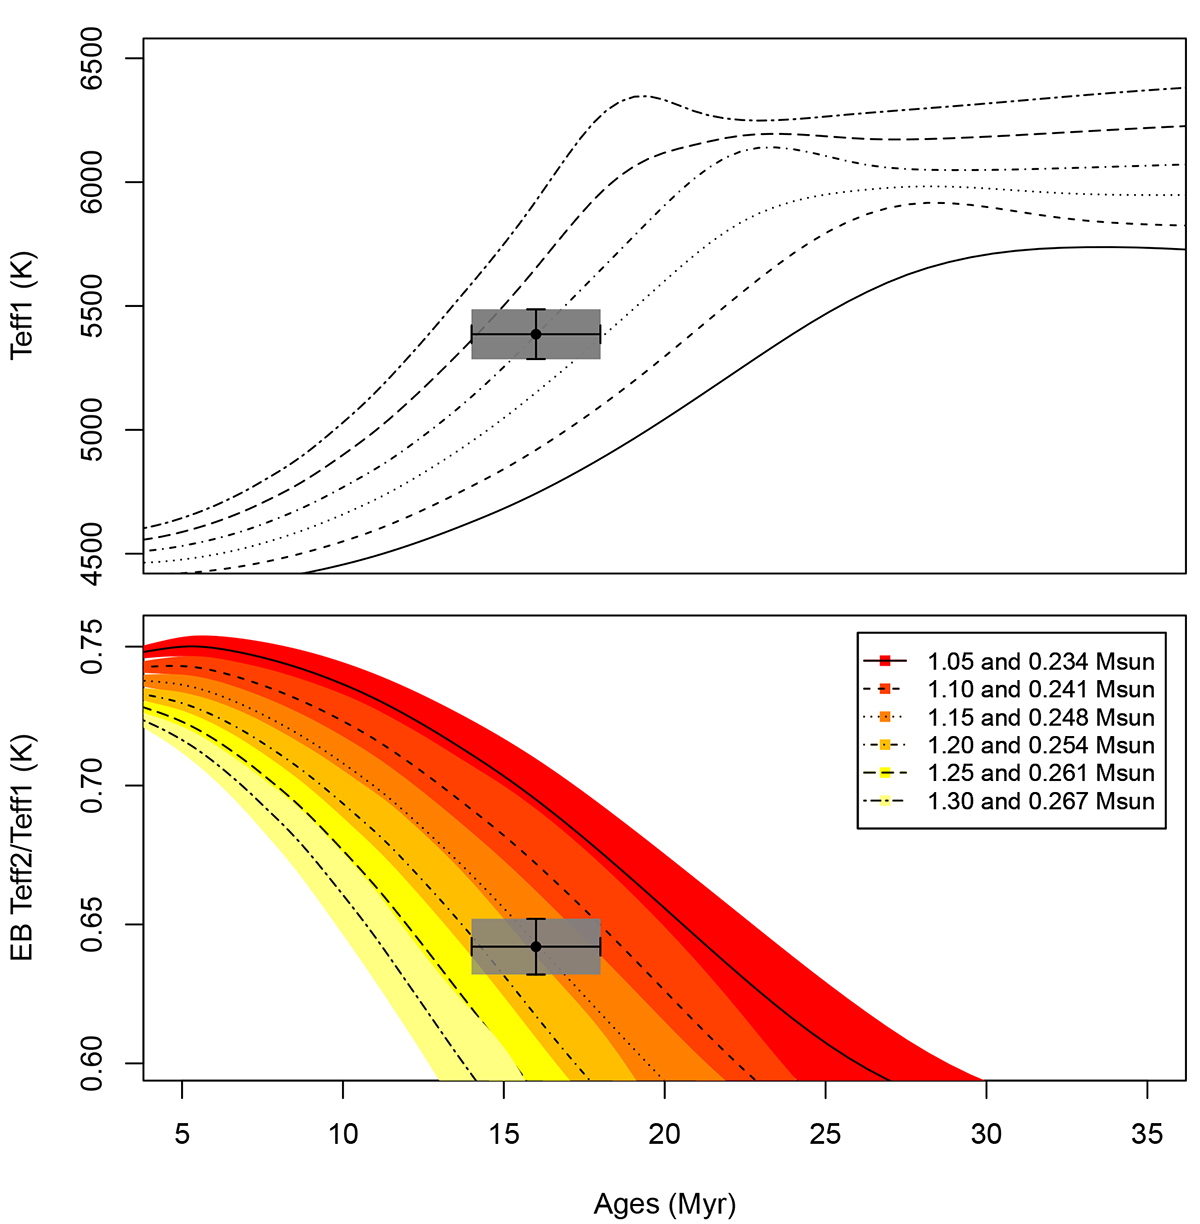
Fig. 7.
Download original image
Estimation of mass of primary star done by comparing the Baraffe et al. (2015) stellar-evolution models to measured effective temperature of primary star (Sect. 2.2.2) in the top panel and to temperature ratio measured from the relative eclipse depths (Sect. 3.6) in the bottom panel at the measured age of 16 ± 2 Myr for UCL. Our measurements are marked by the black point with a 1-σ uncertainty given in the gray-shaded region. The different lines show the evolution of stars with masses between 1.05 and 1.30 M⊙; the color-shaded areas show the range of temperature ratios associated with each primary star mass.
Current usage metrics show cumulative count of Article Views (full-text article views including HTML views, PDF and ePub downloads, according to the available data) and Abstracts Views on Vision4Press platform.
Data correspond to usage on the plateform after 2015. The current usage metrics is available 48-96 hours after online publication and is updated daily on week days.
Initial download of the metrics may take a while.