Fig. 9.
Download original image
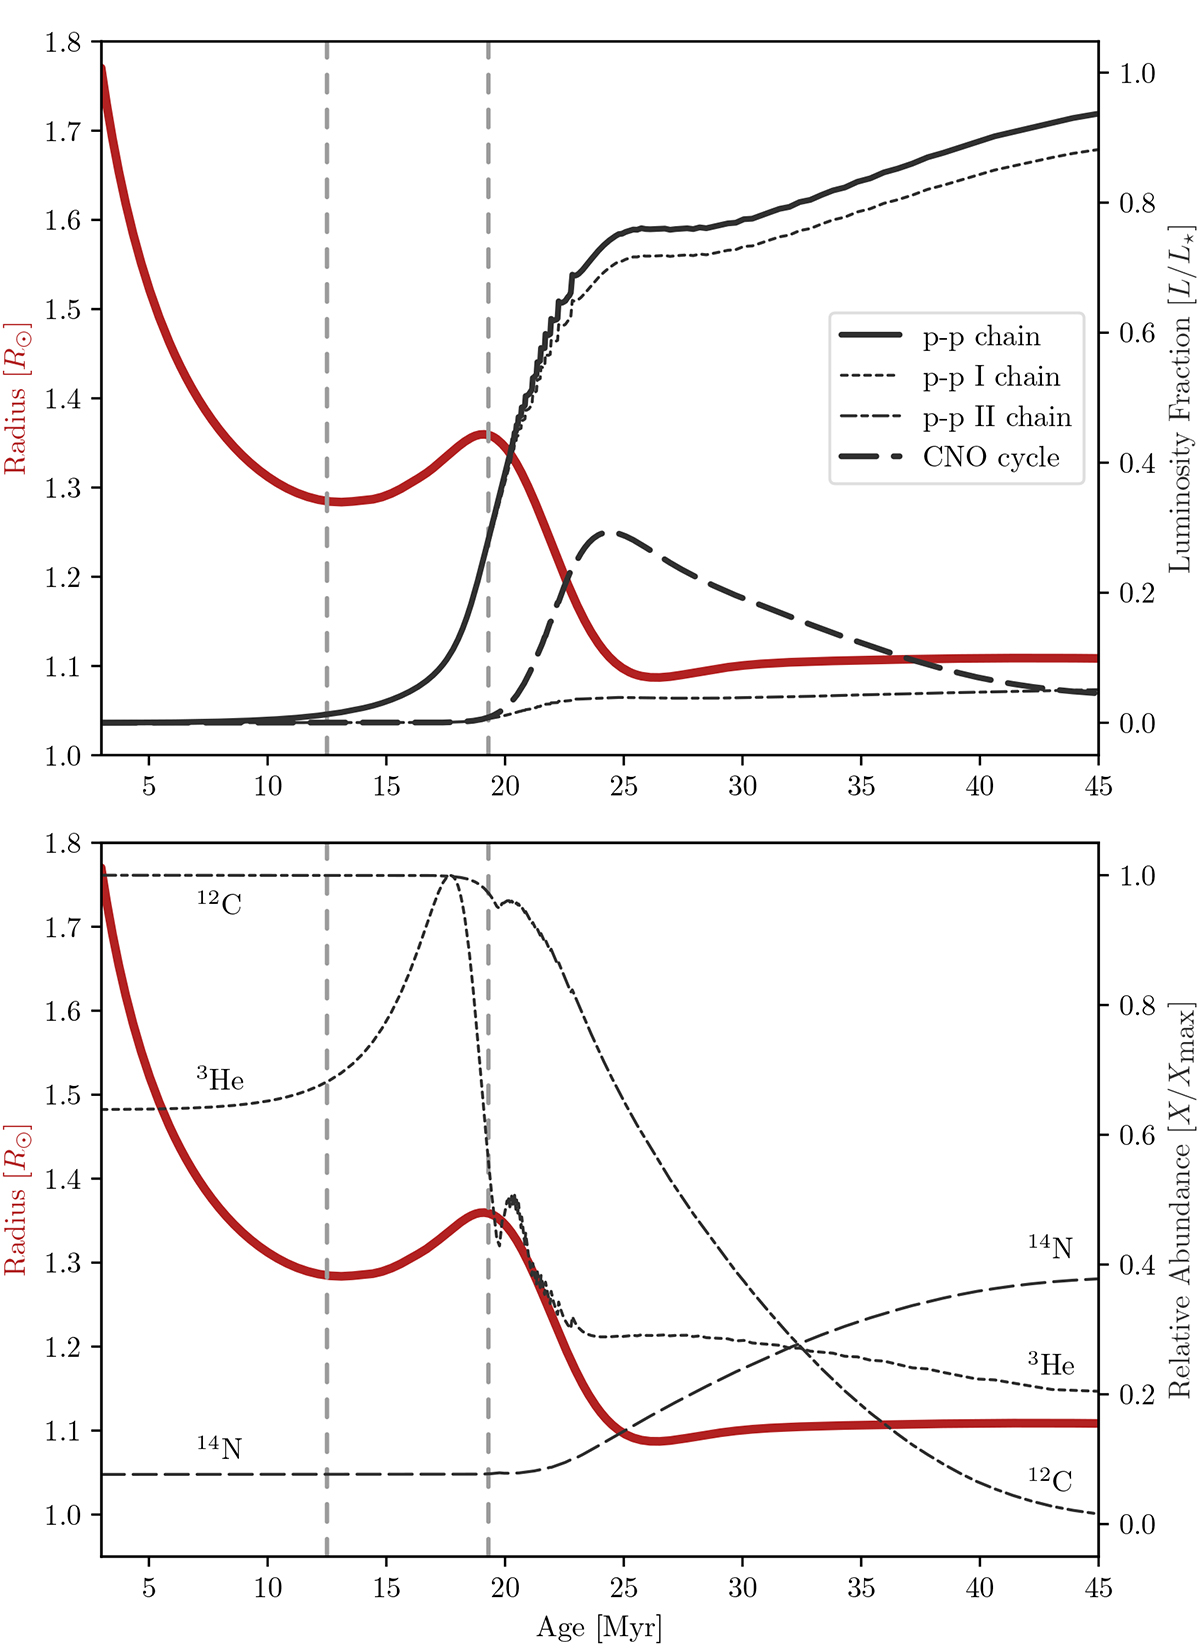
Radius evolution of a 1.2 M⊙ nonmagnetic Dartmouth stellar-evolution model mass track (solid red line). This is shown with (top) the luminosity evolution of the p-p chain (solid black line) and CNO cycle (dashed black line) as a fraction of the total stellar luminosity and (bottom) the evolution of the central abundance of 3He, 12C, and 14N. Vertical lines denote the start and end of the first fusion bump.
Current usage metrics show cumulative count of Article Views (full-text article views including HTML views, PDF and ePub downloads, according to the available data) and Abstracts Views on Vision4Press platform.
Data correspond to usage on the plateform after 2015. The current usage metrics is available 48-96 hours after online publication and is updated daily on week days.
Initial download of the metrics may take a while.