Open Access
Fig. C.1
Download original image
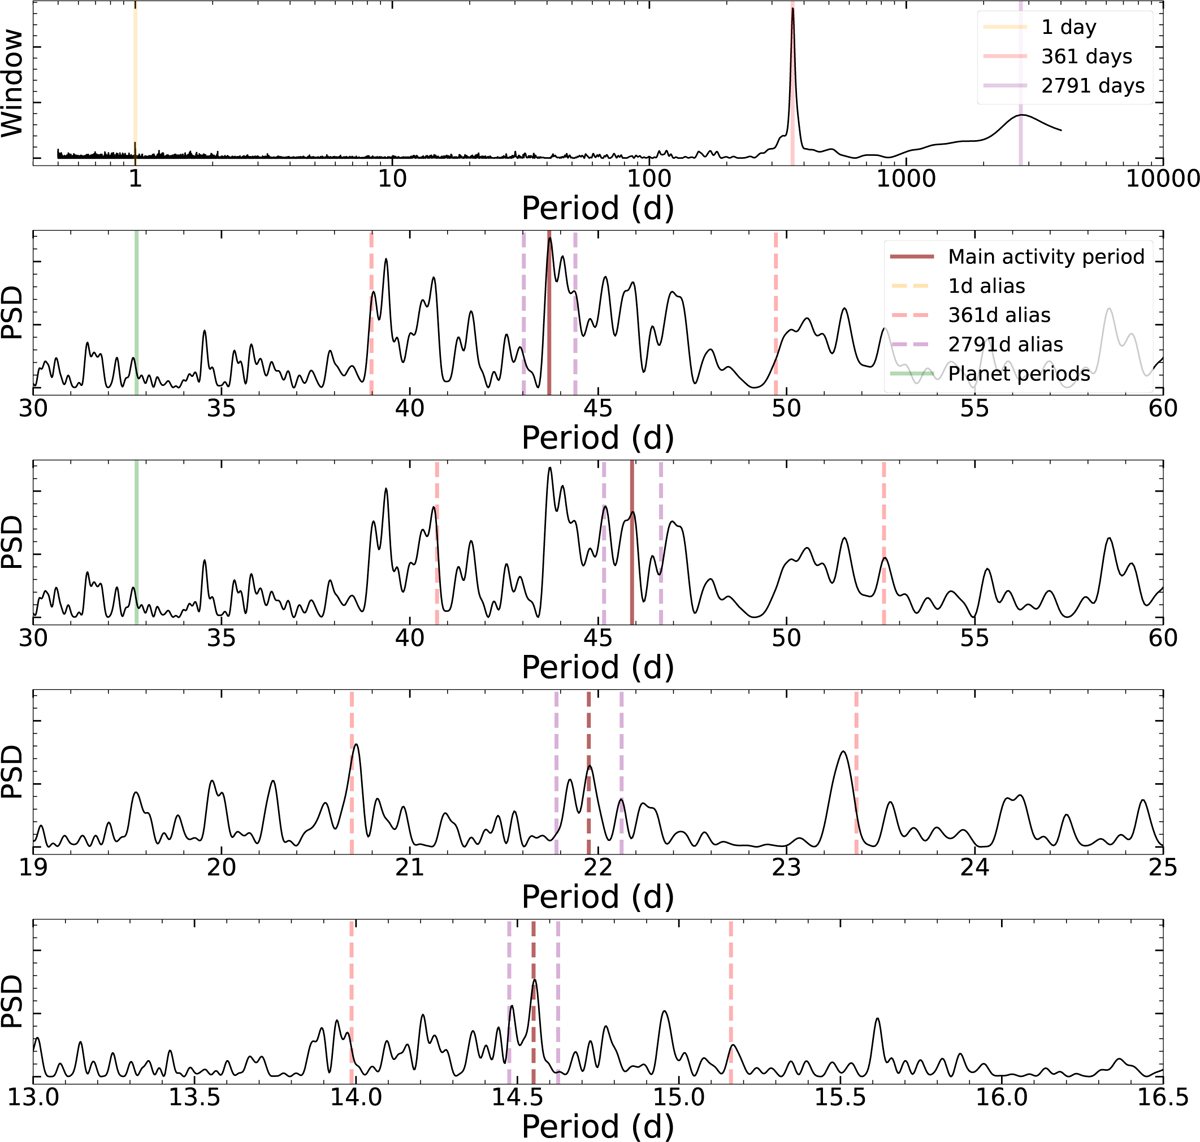
Aliasing of activity signals. The top panel shows the window function of the RV data, with the main peakis suspected of creating aliases hightlighted. The rest of the panels show the periodogram of the activity-only RVs, with the suspected peaks created by activity highlighted, along with their main aliases.
Current usage metrics show cumulative count of Article Views (full-text article views including HTML views, PDF and ePub downloads, according to the available data) and Abstracts Views on Vision4Press platform.
Data correspond to usage on the plateform after 2015. The current usage metrics is available 48-96 hours after online publication and is updated daily on week days.
Initial download of the metrics may take a while.