Fig. 2
Download original image
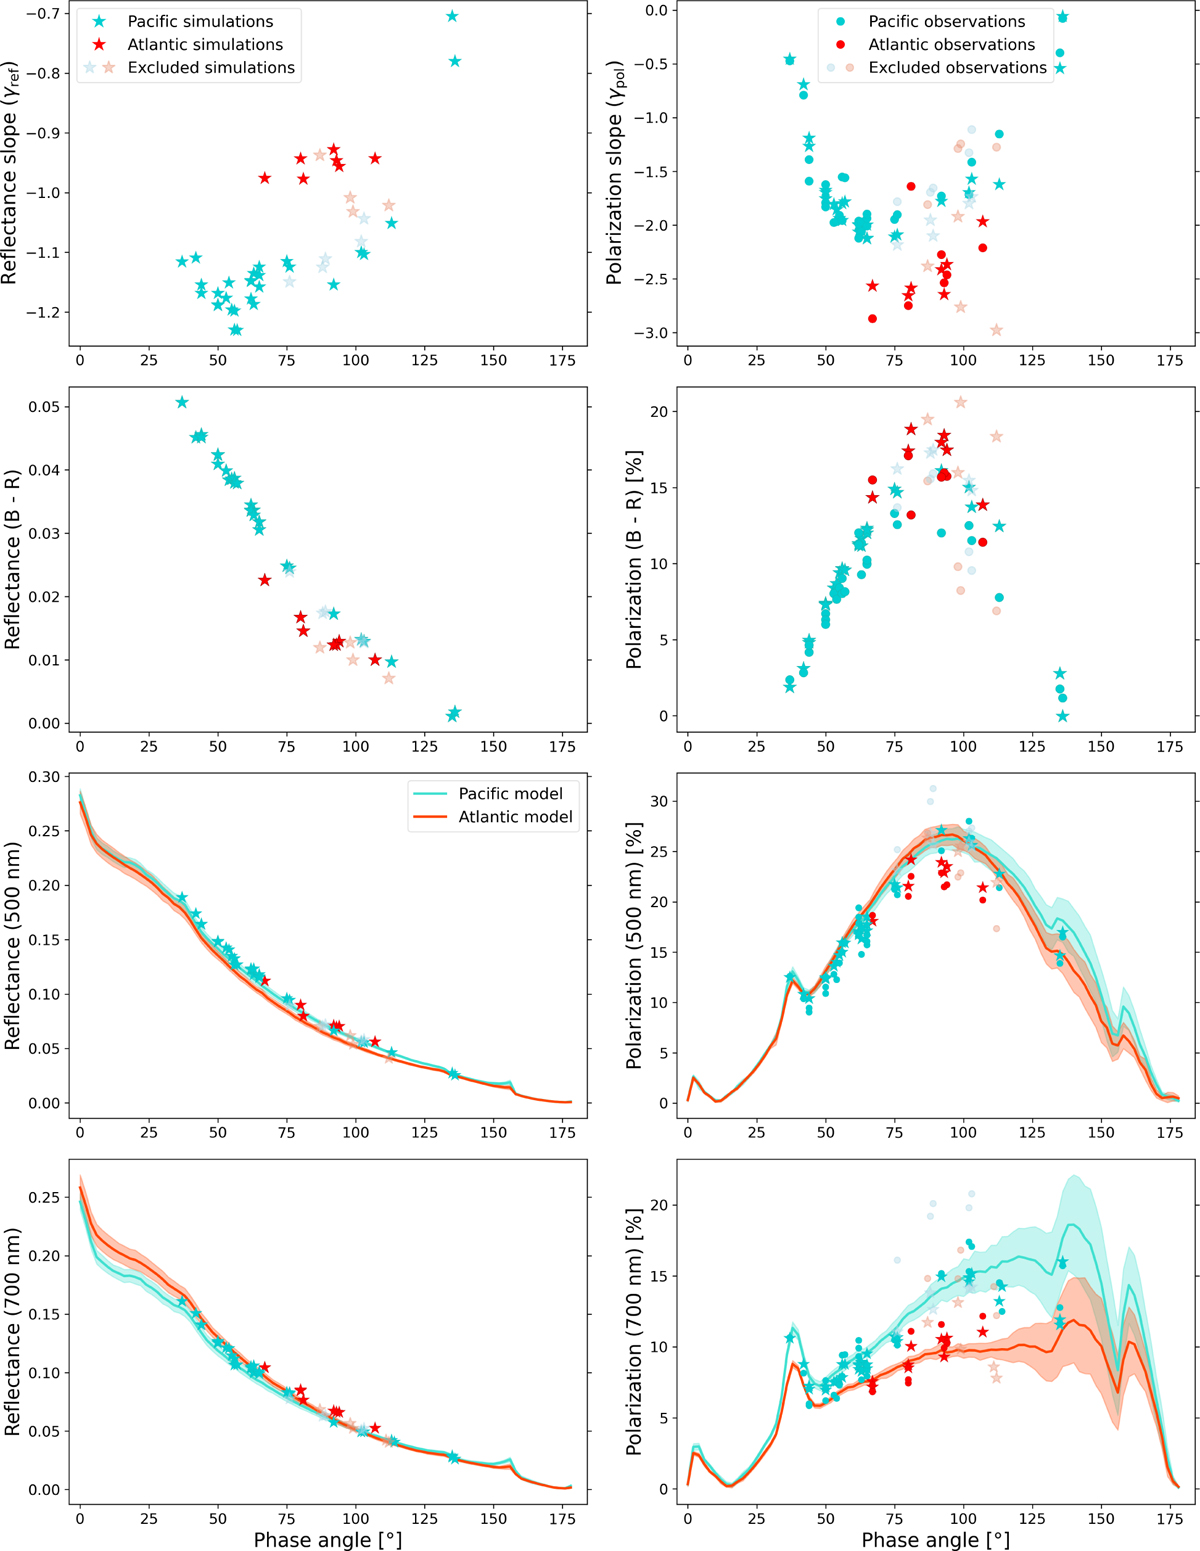
Reflectance simulations (first column) and polarized observations and simulations (second column) from our Earthshine catalog. We examine different diagnostic metrics: the spectral slope in the visible range (first row), the B–R broadband difference (second row), and the continuum reflectance or polarization at single wavelengths (λ = 500 nm and 700 nm; third and fourth rows, respectively), to assess whether we can reliably distinguish between Pacific (ocean-dominated) and Atlantic (mixed land-ocean) viewing geometries. The simulated values at single wavelengths in both reflected and polarized light are derived from the reference phase curves presented in Roccetti et al. (2025a), with the shaded regions indicating the 1σ cloud variability spread.
Current usage metrics show cumulative count of Article Views (full-text article views including HTML views, PDF and ePub downloads, according to the available data) and Abstracts Views on Vision4Press platform.
Data correspond to usage on the plateform after 2015. The current usage metrics is available 48-96 hours after online publication and is updated daily on week days.
Initial download of the metrics may take a while.