Fig. 4
Download original image
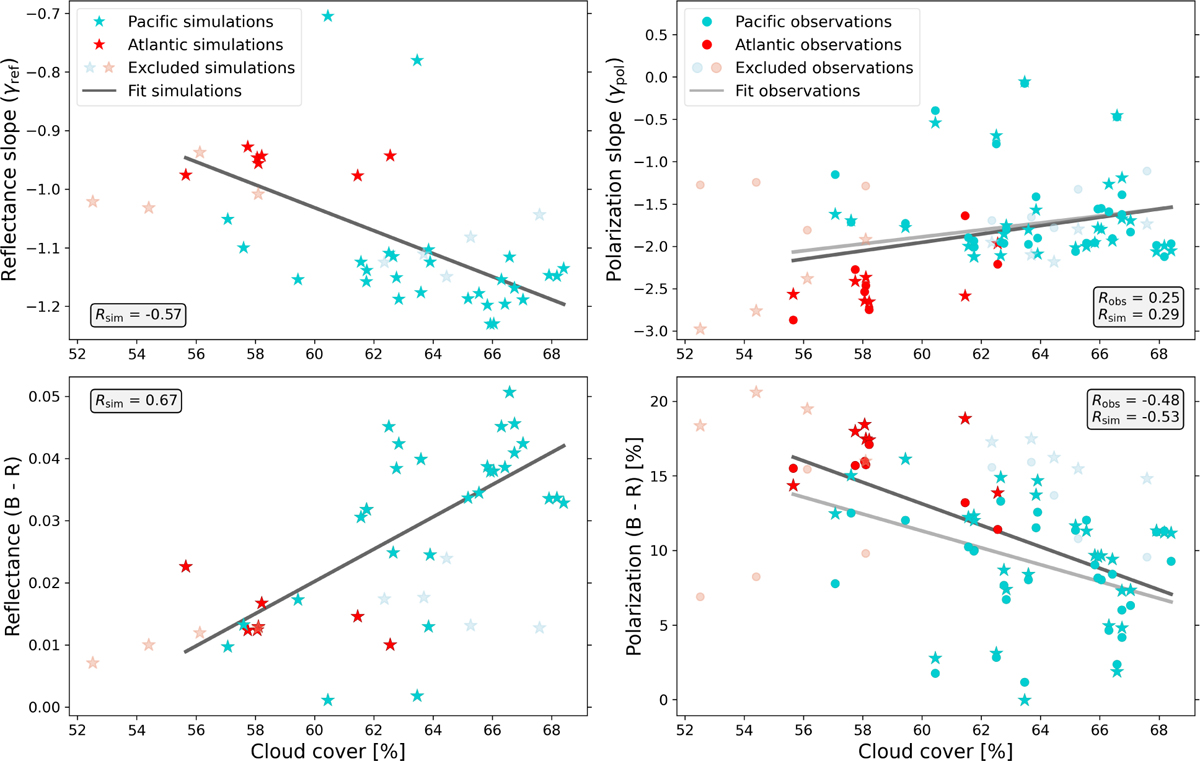
Correlations between the cloud cover and the VIS spectral slopes (first row) and the B-R broadband filter differences (second row) for reflectance simulations (first column) and polarized simulations and observations (second column). We provide the Pearson correlation coefficient (R) values and the linear fits for the simulations (black) and observations (gray).
Current usage metrics show cumulative count of Article Views (full-text article views including HTML views, PDF and ePub downloads, according to the available data) and Abstracts Views on Vision4Press platform.
Data correspond to usage on the plateform after 2015. The current usage metrics is available 48-96 hours after online publication and is updated daily on week days.
Initial download of the metrics may take a while.