Open Access
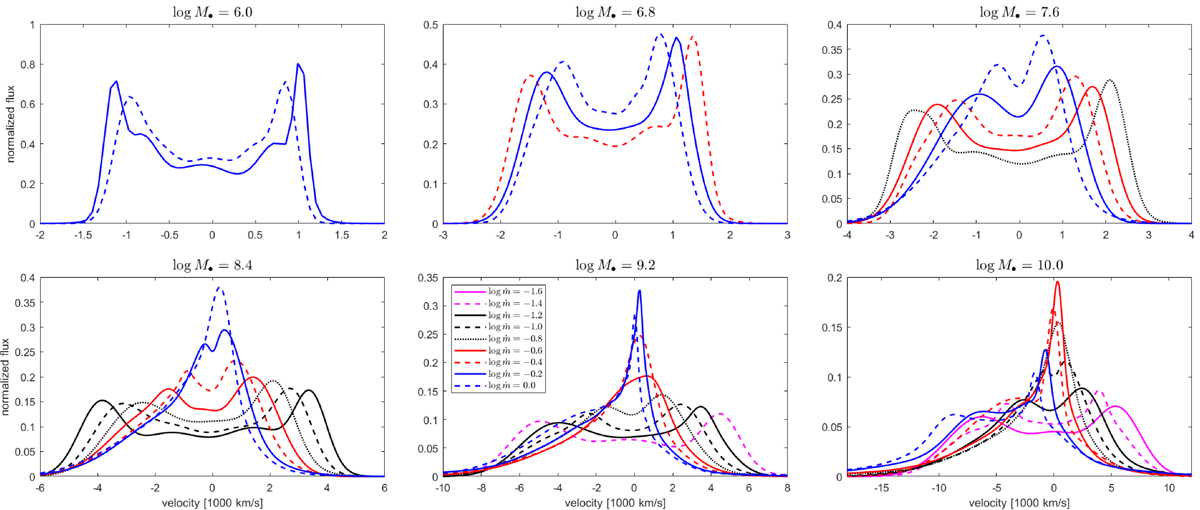
Fig. 2.
Download original image
Predicted Hβ line profiles grouped by black hole mass, assuming a fixed viewing angle of 39°. Different curves within each panel correspond to representative Eddington ratios (see text for details). Note: the horizontal axis scale varies between panels. All profiles are normalized to the unit total flux.
Current usage metrics show cumulative count of Article Views (full-text article views including HTML views, PDF and ePub downloads, according to the available data) and Abstracts Views on Vision4Press platform.
Data correspond to usage on the plateform after 2015. The current usage metrics is available 48-96 hours after online publication and is updated daily on week days.
Initial download of the metrics may take a while.