Open Access
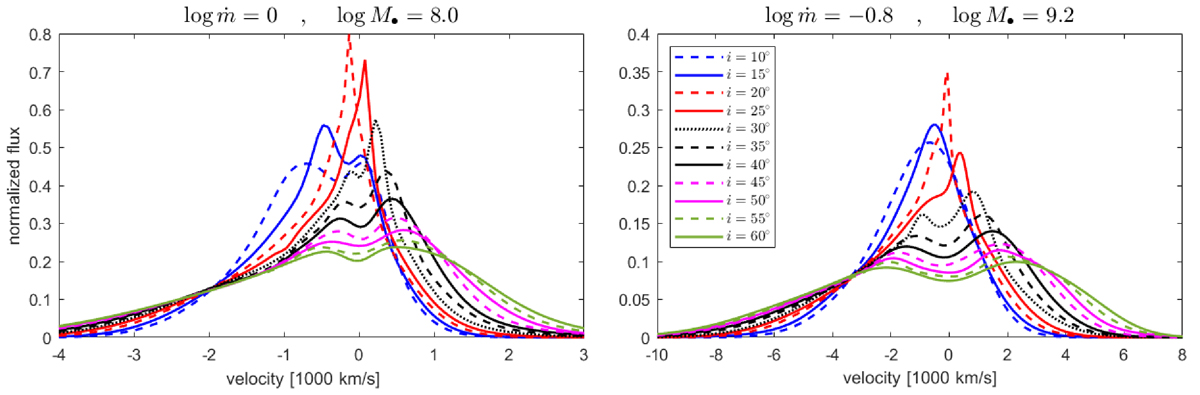
Fig. 4.
Download original image
Dependence of Hβ line profile shape on viewing angle. Results are shown for two representative models from our simulation grid. The left panel corresponds to a canonical AGN model and the right panel represents the mean quasar. All profiles are normalized to unit total flux.
Current usage metrics show cumulative count of Article Views (full-text article views including HTML views, PDF and ePub downloads, according to the available data) and Abstracts Views on Vision4Press platform.
Data correspond to usage on the plateform after 2015. The current usage metrics is available 48-96 hours after online publication and is updated daily on week days.
Initial download of the metrics may take a while.