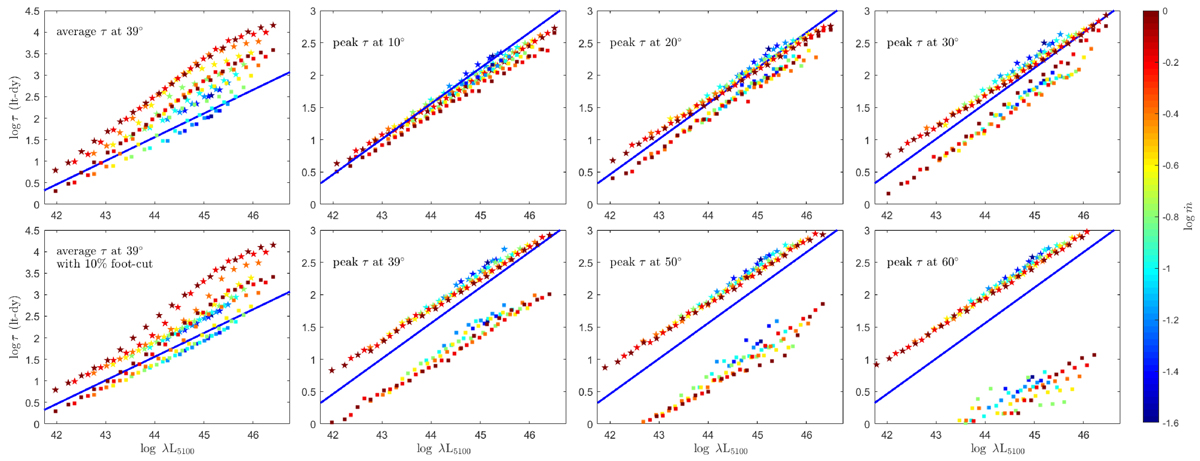
Fig. 8.
Download original image
R–L relation for various viewing angles and BLR configurations, for the two options of measuring the time-lags: average values (left-most two panels) and peak values (other panels). The blue line in each panel represents the empirical R–L relation calibrated for low accretors from (Bentz et al. 2013), the fully corrected fit with slope of 0.546 and interception value of 1.559. Color-coded data points correspond to different Eddington ratios as indicated by the colorbar. Pentagrams represent the far side of BLR relative to the observer, while squares correspond to the near side.
Current usage metrics show cumulative count of Article Views (full-text article views including HTML views, PDF and ePub downloads, according to the available data) and Abstracts Views on Vision4Press platform.
Data correspond to usage on the plateform after 2015. The current usage metrics is available 48-96 hours after online publication and is updated daily on week days.
Initial download of the metrics may take a while.