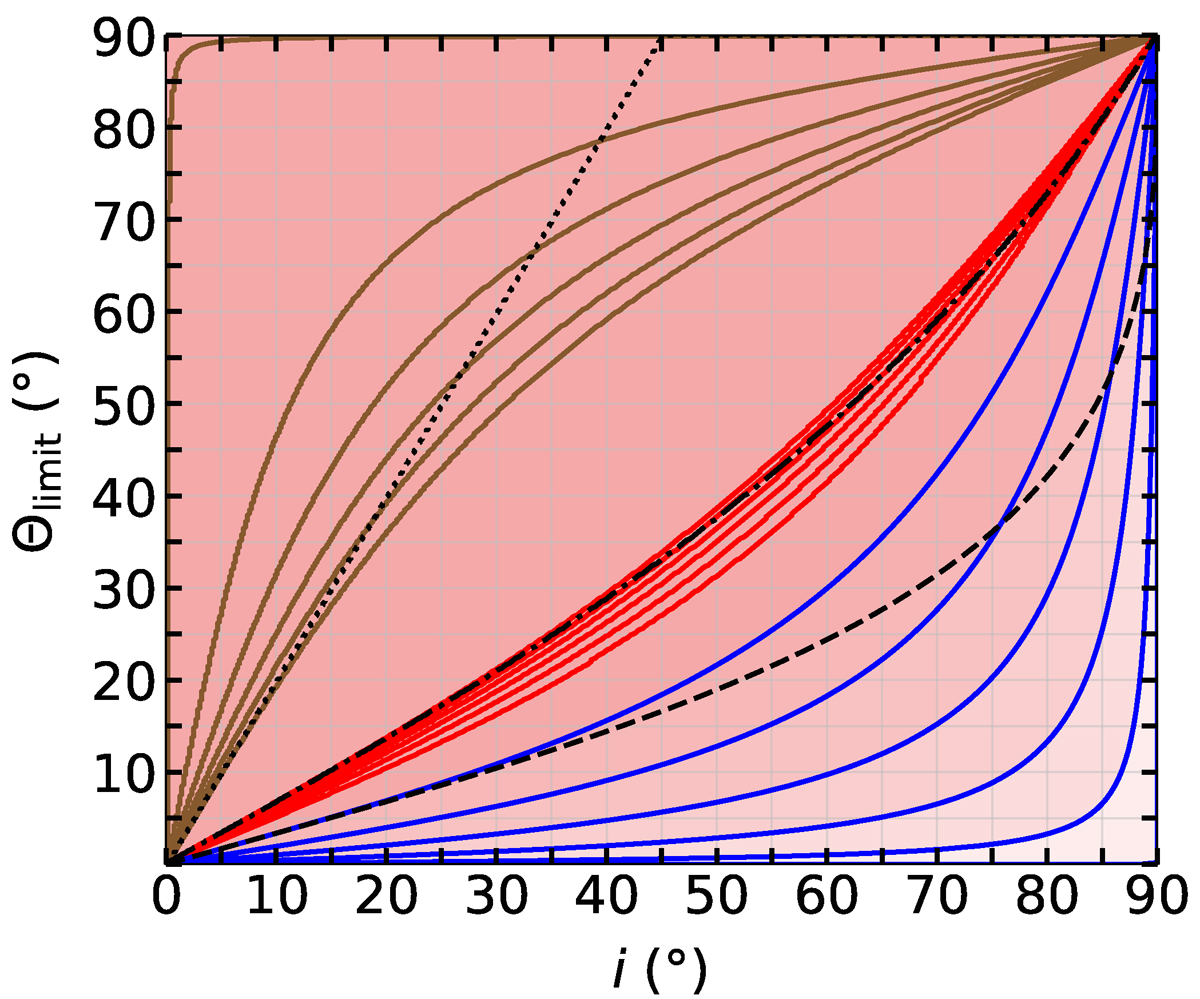
Fig. A.1.
Download original image
Obscuration limits for the studied geometries. In blue we show the Θlimit(i) curves for the elliptical torus, which determine the lower limit in Θ, below which no directly illuminated part of the elliptical torus is directly observable due to self-obscuration. From bottom to top, we show the cases of ρ/ρin = 1.001, 1.2, 1.4, 1.6, 1.8, 1.999, respectively. The dashed black line is the inverse of the function (A.1), i.e., Θlimit, c(i) for the special case of a circular torus, which effectively spans through all ρ = ρc(Θlimit)∈(1; 2) according to equation (1). In our geometrical assumption, such a general limitation to the parameter space due to self-obscuration does not appear for the cone and bowl geometries. In red we show the Θlimit(i) curves for the cone geometry, which determine the lower limit in Θ, below which no part of the double-cone inner surface below the equator (at z < 0) is directly observable due to self-obscuration. From bottom to top we show the same cases of ρ/ρin = 1.001, 1.2, 1.4, 1.6, 1.8, 1.999, respectively, and the dash-and-dot line represents the ρ = ρc(Θlimit) case according to (1). In brown we show the Θlimit(i) curves for the cone geometry, which determine the upper limit in Θ, above which no part of the double-cone inner surface below the equator (at z < 0) is directly observable due to self-obscuration. From top to bottom we show the same cases of ρ/ρin = 1.001, 1.2, 1.4, 1.6, 1.8, 1.999, respectively, and the dotted line represents the ρ = ρc(Θlimit) case according to (1). Equivalent red, brown, dot-and-dashed, and dotted curves for the bowl and torus geometries are nearly identical. We note that the axes of this figure nearly overlap with the extreme case of ρ/ρin = 1.001 in blue and brown colors.
Current usage metrics show cumulative count of Article Views (full-text article views including HTML views, PDF and ePub downloads, according to the available data) and Abstracts Views on Vision4Press platform.
Data correspond to usage on the plateform after 2015. The current usage metrics is available 48-96 hours after online publication and is updated daily on week days.
Initial download of the metrics may take a while.