Fig. 4.
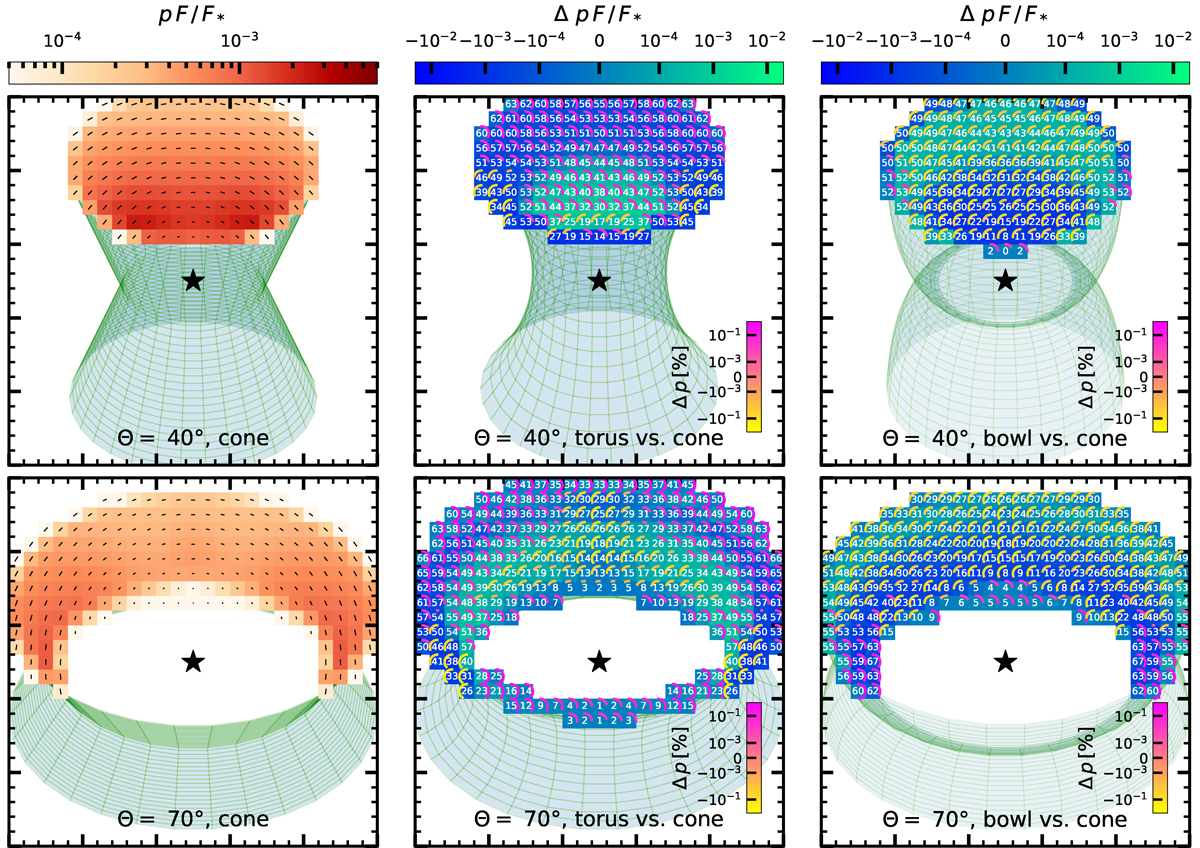
Download original image
Images of the reflecting walls of a cone (left), a torus (center), and a bowl (right) with ξ0 = 500 erg ⋅ cm ⋅ s−1 and half-opening angles Θ = 40° (top) and Θ = 70° (bottom). Each image contains 25 × 25 pixels with spectro-polarimetric information integrated in the 3.5–6 keV band, if subtending the observable reflecting area. We used the color code for the background of each reflecting pixel to emphasize the polarized flux, pF/F*, where F* is the flux of the primary source in observer’s direction, for the cone; and the polarized flux difference, ΔpF/F*, for the torus and bowl, which is the polarized flux, pF/F*, of the reflecting cone subtracted from the polarized flux, pF/F*, of the reflecting torus or bowl in the same pixel for identical configurations. For the cone, each reflecting pixel contains a polarization bar, whose length is proportional to the observed polarization degree from that pixel and whose tilt from the vertical direction is corresponding to its polarization angle. For the torus and bowl, each reflecting pixel contains a number, which is the observed polarization degree in % from that pixel, and a separately color-coded arc, whose length, direction and color are altogether highlighting the polarization degree difference Δp in %, which is the polarization degree p of the reflecting cone subtracted from the polarization degree p of the reflecting torus or bowl, respectively, in the same pixel for identical configurations. All other parameter values are the same as in Fig. 3.
Current usage metrics show cumulative count of Article Views (full-text article views including HTML views, PDF and ePub downloads, according to the available data) and Abstracts Views on Vision4Press platform.
Data correspond to usage on the plateform after 2015. The current usage metrics is available 48-96 hours after online publication and is updated daily on week days.
Initial download of the metrics may take a while.