Fig. 1
Download original image
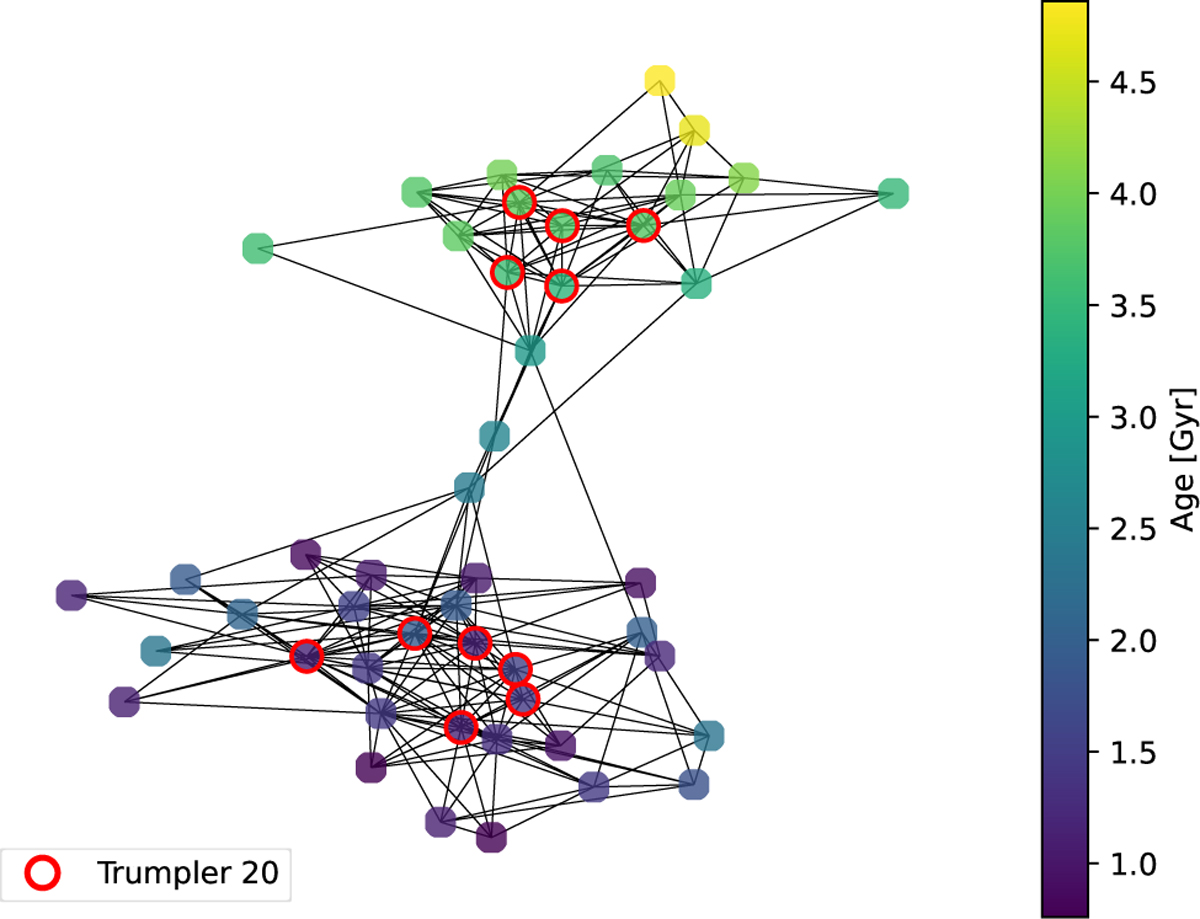
Portion of the graph processed by the GATE. This subgraph shows all nodes belonging to Trumpler 20 and all their immediate neighbors. Edges between all nodes are shown as solid black lines. Cluster members are highlighted by a red circle. Each node is color-coded based on the stellar age. Nodes are arranged in the plane to minimize the distance between connected nodes.
Current usage metrics show cumulative count of Article Views (full-text article views including HTML views, PDF and ePub downloads, according to the available data) and Abstracts Views on Vision4Press platform.
Data correspond to usage on the plateform after 2015. The current usage metrics is available 48-96 hours after online publication and is updated daily on week days.
Initial download of the metrics may take a while.