Fig. 3
Download original image
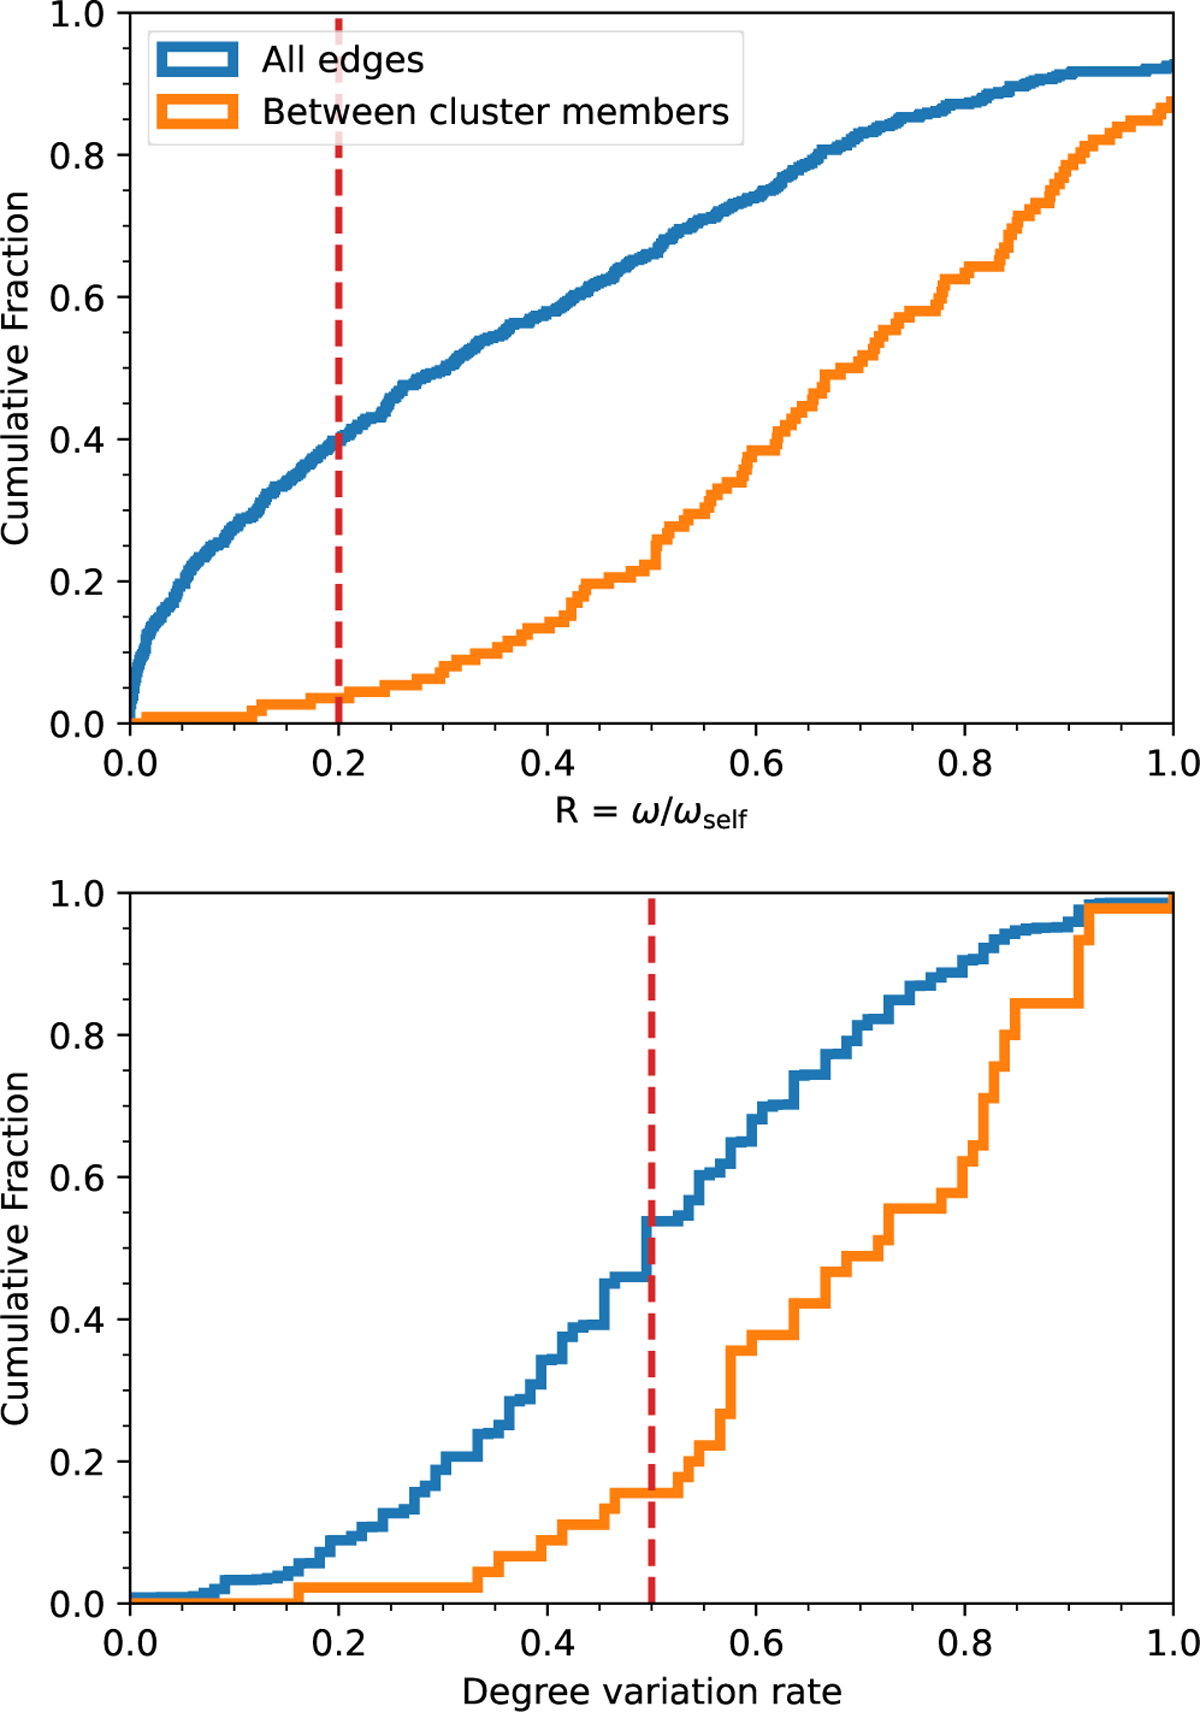
Top panel: the histogram shows the cumulative fraction of the ratio R = ω/ωself for all edges (blue) and for the edges connecting members of the same cluster from the calibration set (orange). The dashed red line indicates the threshold below which we consider the edge as non-significative and we remove it from the graph. Bottom panel: the histogram shows the cumulative fraction of the ratio between the node degrees after and before the edge breaking. All stars are shown in blue, while members of the calibration set are in orange. The dashed red line indicates the threshold below which we consider the star as “migrator.”
Current usage metrics show cumulative count of Article Views (full-text article views including HTML views, PDF and ePub downloads, according to the available data) and Abstracts Views on Vision4Press platform.
Data correspond to usage on the plateform after 2015. The current usage metrics is available 48-96 hours after online publication and is updated daily on week days.
Initial download of the metrics may take a while.