Fig. 5
Download original image
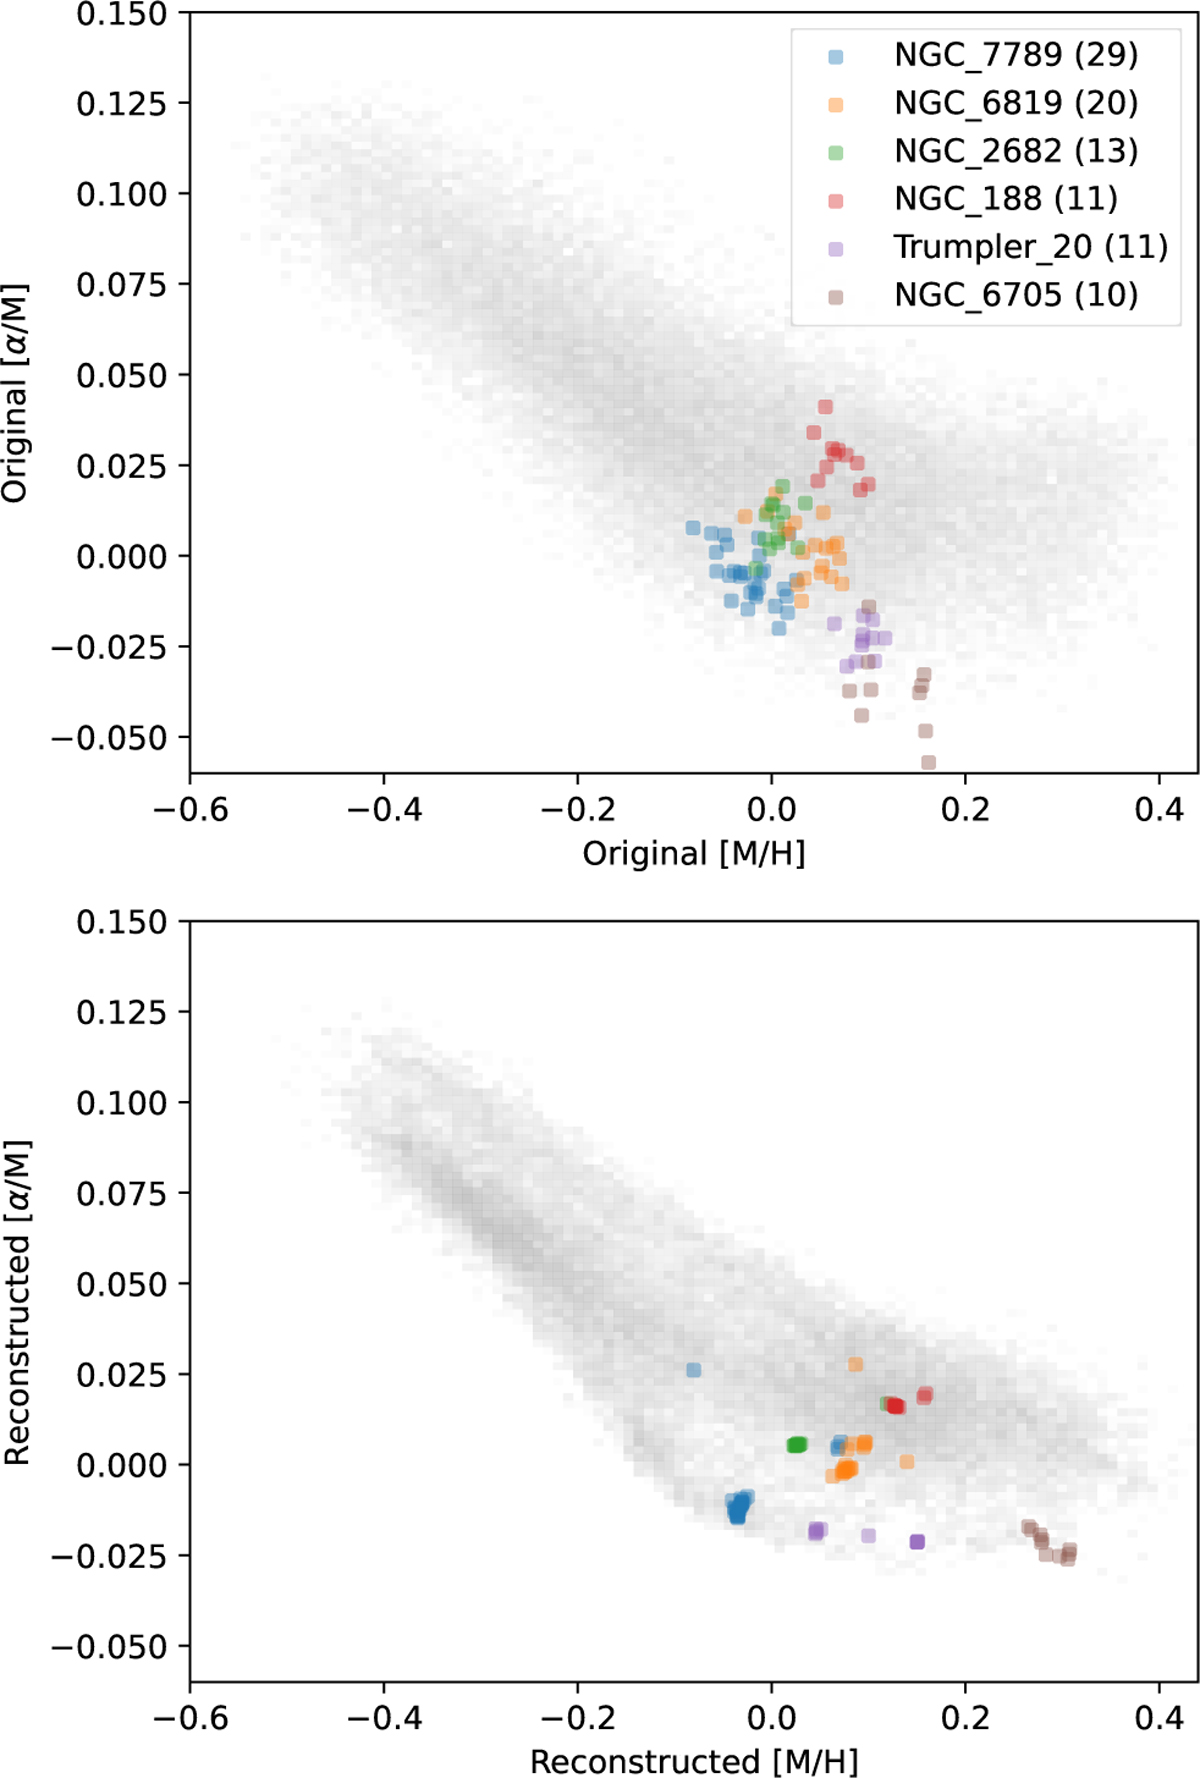
Top panel: the plot shows the distribution of stars from the full dataset (shades of gray) and members of the open clusters from the target set (colored points) in the original [α/M]–[M/H] diagram. Bottom panel: as a comparison we show the same diagram of the top panel reconstructed by the GATE. This chemical space has been selectively informed by kinematics as it is described in Section 2.
Current usage metrics show cumulative count of Article Views (full-text article views including HTML views, PDF and ePub downloads, according to the available data) and Abstracts Views on Vision4Press platform.
Data correspond to usage on the plateform after 2015. The current usage metrics is available 48-96 hours after online publication and is updated daily on week days.
Initial download of the metrics may take a while.