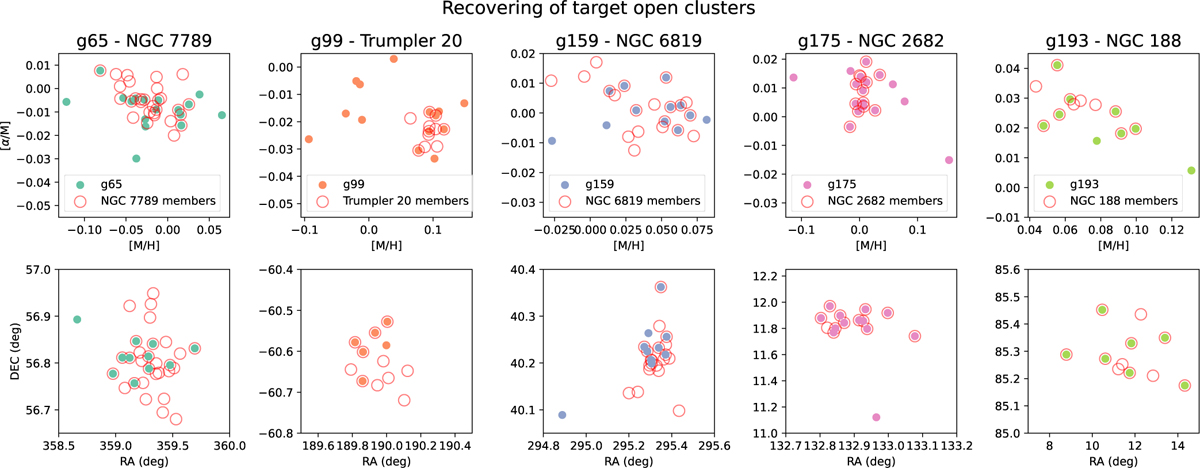
Fig. 7
Download original image
These panels illustrate the effectiveness of our method in recovering the target open clusters. The top panels display, for each group and its associated open cluster, the distribution of stars in the [α/M]–[M/H] plane. Filled symbols represent the stars belonging to each high-density group identified by OPTICS, while red circles indicate the true members of the open clusters. The bottom panels provide a zoomed-in view centered on the cluster sky coordinates.
Current usage metrics show cumulative count of Article Views (full-text article views including HTML views, PDF and ePub downloads, according to the available data) and Abstracts Views on Vision4Press platform.
Data correspond to usage on the plateform after 2015. The current usage metrics is available 48-96 hours after online publication and is updated daily on week days.
Initial download of the metrics may take a while.