Fig. 2
Download original image
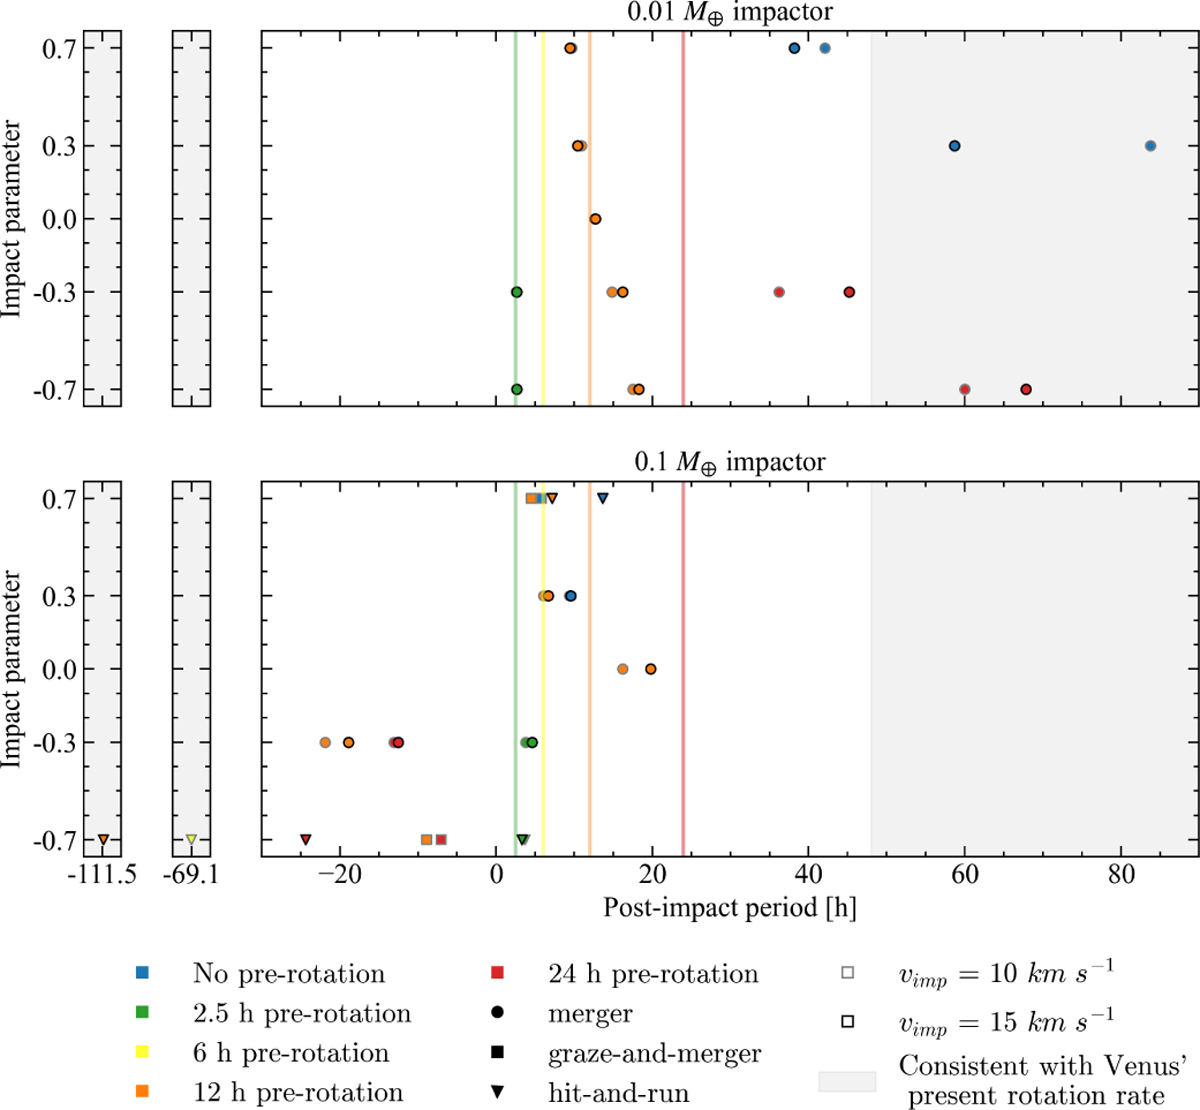
Post-impact rotation period of Venus of the ‘cold models’ inferred from our simulations. The upper panel shows collisions with a 0.01 M⊕ impactor, while the lower panel shows collisions with a 0.1 M⊕ impactor. The marker colour describes the pre-impact rotation period, the edge colour the impact velocity, and the marker symbol the collision outcome according to the legend. The different pre-impact rotation periods are also displayed with the respective coloured vertical lines. The grey area corresponds to periods that are consistent with Venus’ present-day period.
Current usage metrics show cumulative count of Article Views (full-text article views including HTML views, PDF and ePub downloads, according to the available data) and Abstracts Views on Vision4Press platform.
Data correspond to usage on the plateform after 2015. The current usage metrics is available 48-96 hours after online publication and is updated daily on week days.
Initial download of the metrics may take a while.