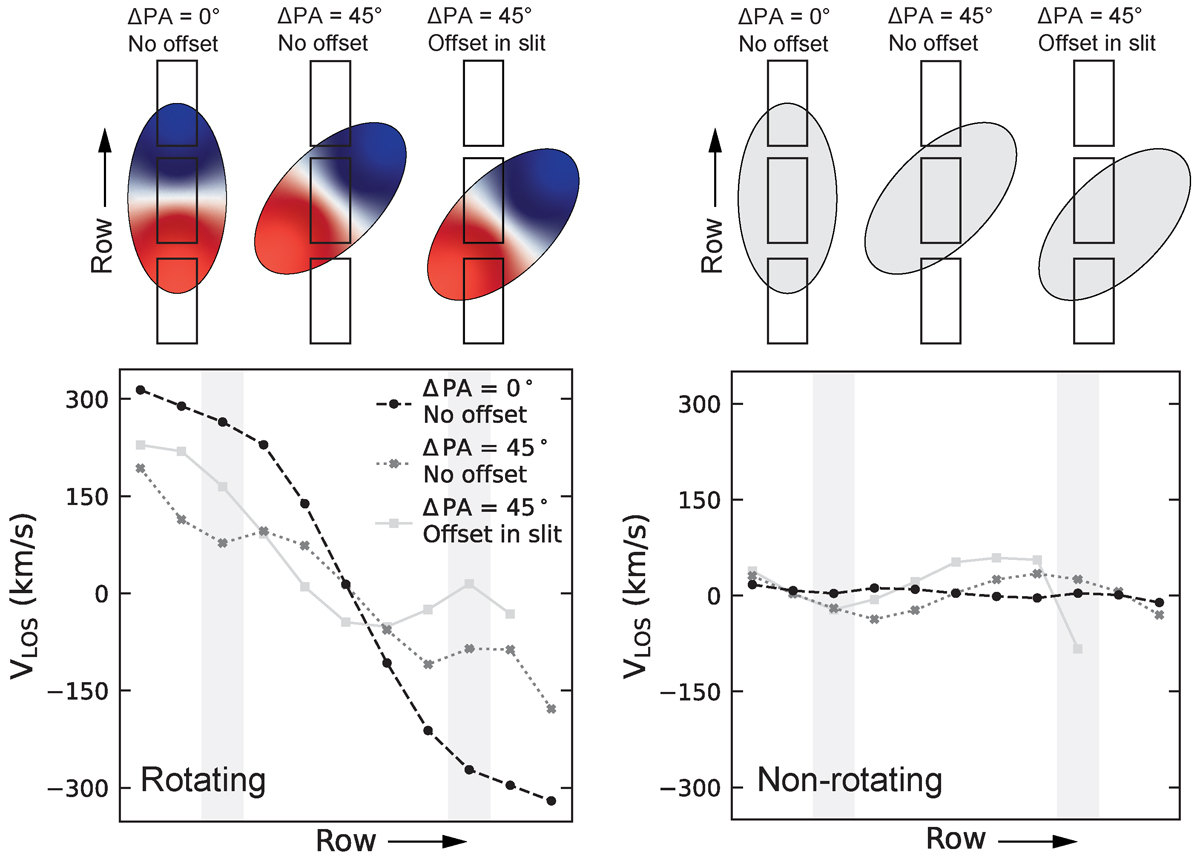
Fig. 1.
Download original image
LOS velocity profiles for a model galaxy that is perfectly aligned and centred (left, black circles), a model galaxy that is perfectly centred but misaligned (middle, dark grey crosses), and a model galaxy that is offset and misaligned (right, light grey squares) with respect to the central micro-shutter. The left panels show the models for a galaxy with an intrinsic velocity field with a maximum rotational velocity of 300 km s−1. The right panels show the LOS velocity profiles for a galaxy without intrinsic rotational velocity, representing the effects from optics, the PSF, and data reduction steps. These effects can lead to observed LOS velocities of up to ∼50 km s−1. The modelled galaxies have re = 0.13″(1.1 kpc at z ∼ 1.5), a Sérsic index of 1.5, and an axis ratio q of 0.3. The grey bands indicate the areas of the velocity profile that are affected by bar shadows from the MSA.
Current usage metrics show cumulative count of Article Views (full-text article views including HTML views, PDF and ePub downloads, according to the available data) and Abstracts Views on Vision4Press platform.
Data correspond to usage on the plateform after 2015. The current usage metrics is available 48-96 hours after online publication and is updated daily on week days.
Initial download of the metrics may take a while.