Fig. D.1.
Download original image
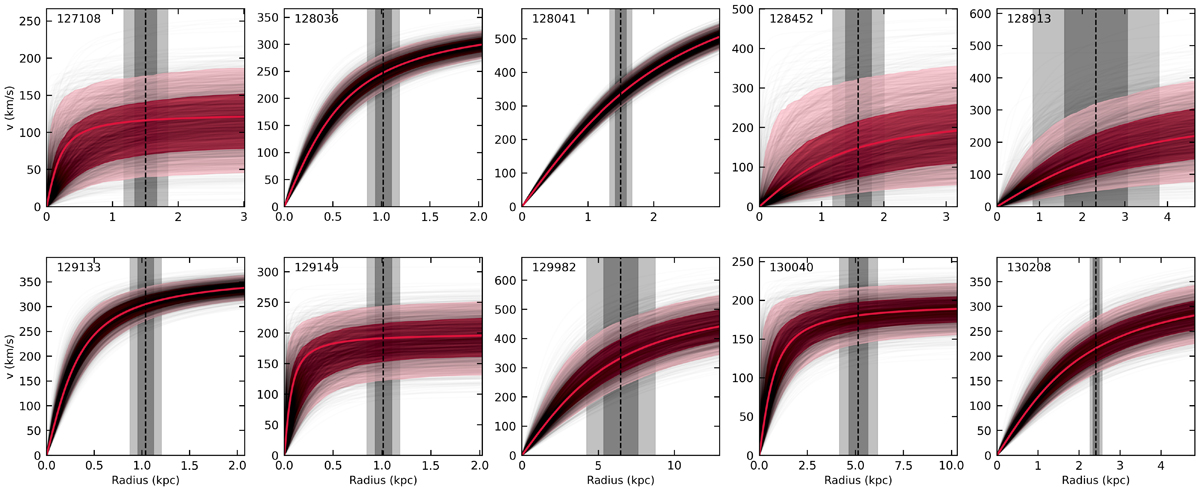
Intrinsic velocity as a function of radius from Equation (1), for 2000 simulations of va, re, and rt/re, randomly perturbed around their uncertainties (black lines). The solid red line shows the best-fit model, and the 1σ and 2σ levels of v(r) are indicated in pink and red, respectively. The dashed line indicates the measured re, with the 1σ and 2σ levels indicated with grey bands. All 10 galaxies have significant rotation from the 2σ rotation curve limits.
Current usage metrics show cumulative count of Article Views (full-text article views including HTML views, PDF and ePub downloads, according to the available data) and Abstracts Views on Vision4Press platform.
Data correspond to usage on the plateform after 2015. The current usage metrics is available 48-96 hours after online publication and is updated daily on week days.
Initial download of the metrics may take a while.