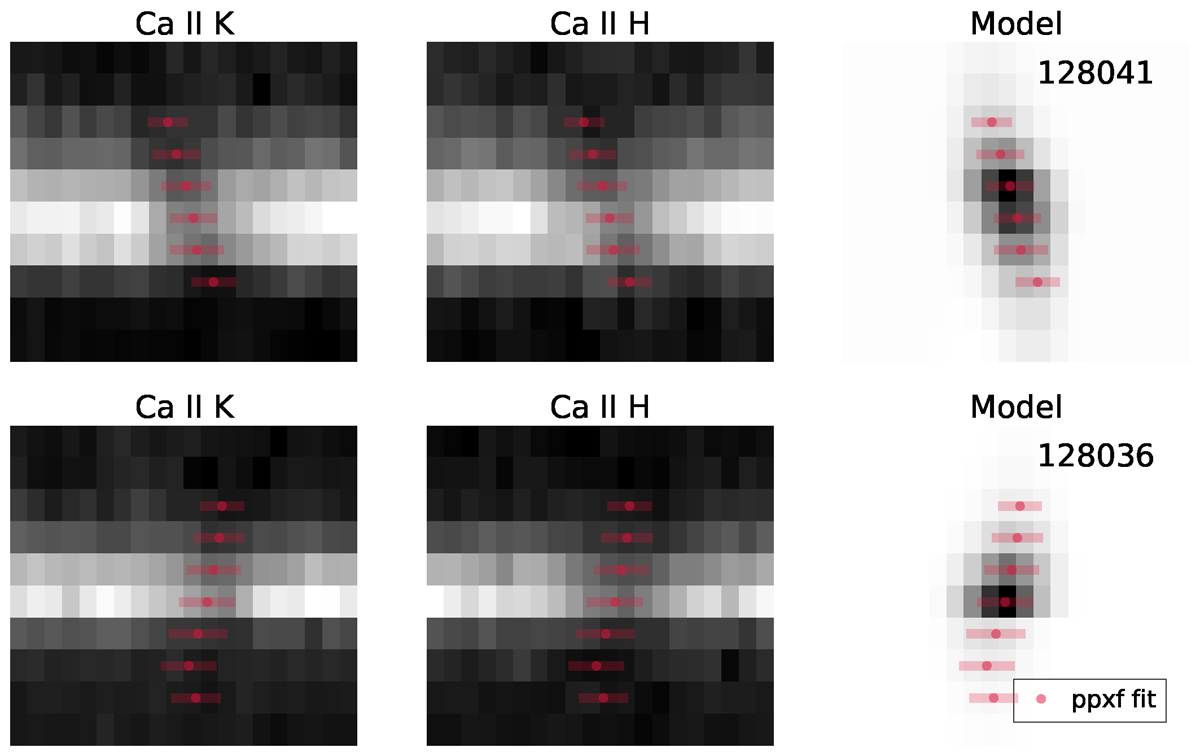
Fig. 2.
Download original image
2D absorption line profiles of CaII K (left) and H (middle), and the best-fit model (right) for two example galaxies. The red points (lines) show the best-fit velocity (velocity dispersion) profile from PPXF that was used as input for our forward modelling in Section 3.3. We note that the PPXF fits were obtained from the entire wavelength range of the spectra, and the two absorption lines illustrated in this figure serve as an example.
Current usage metrics show cumulative count of Article Views (full-text article views including HTML views, PDF and ePub downloads, according to the available data) and Abstracts Views on Vision4Press platform.
Data correspond to usage on the plateform after 2015. The current usage metrics is available 48-96 hours after online publication and is updated daily on week days.
Initial download of the metrics may take a while.