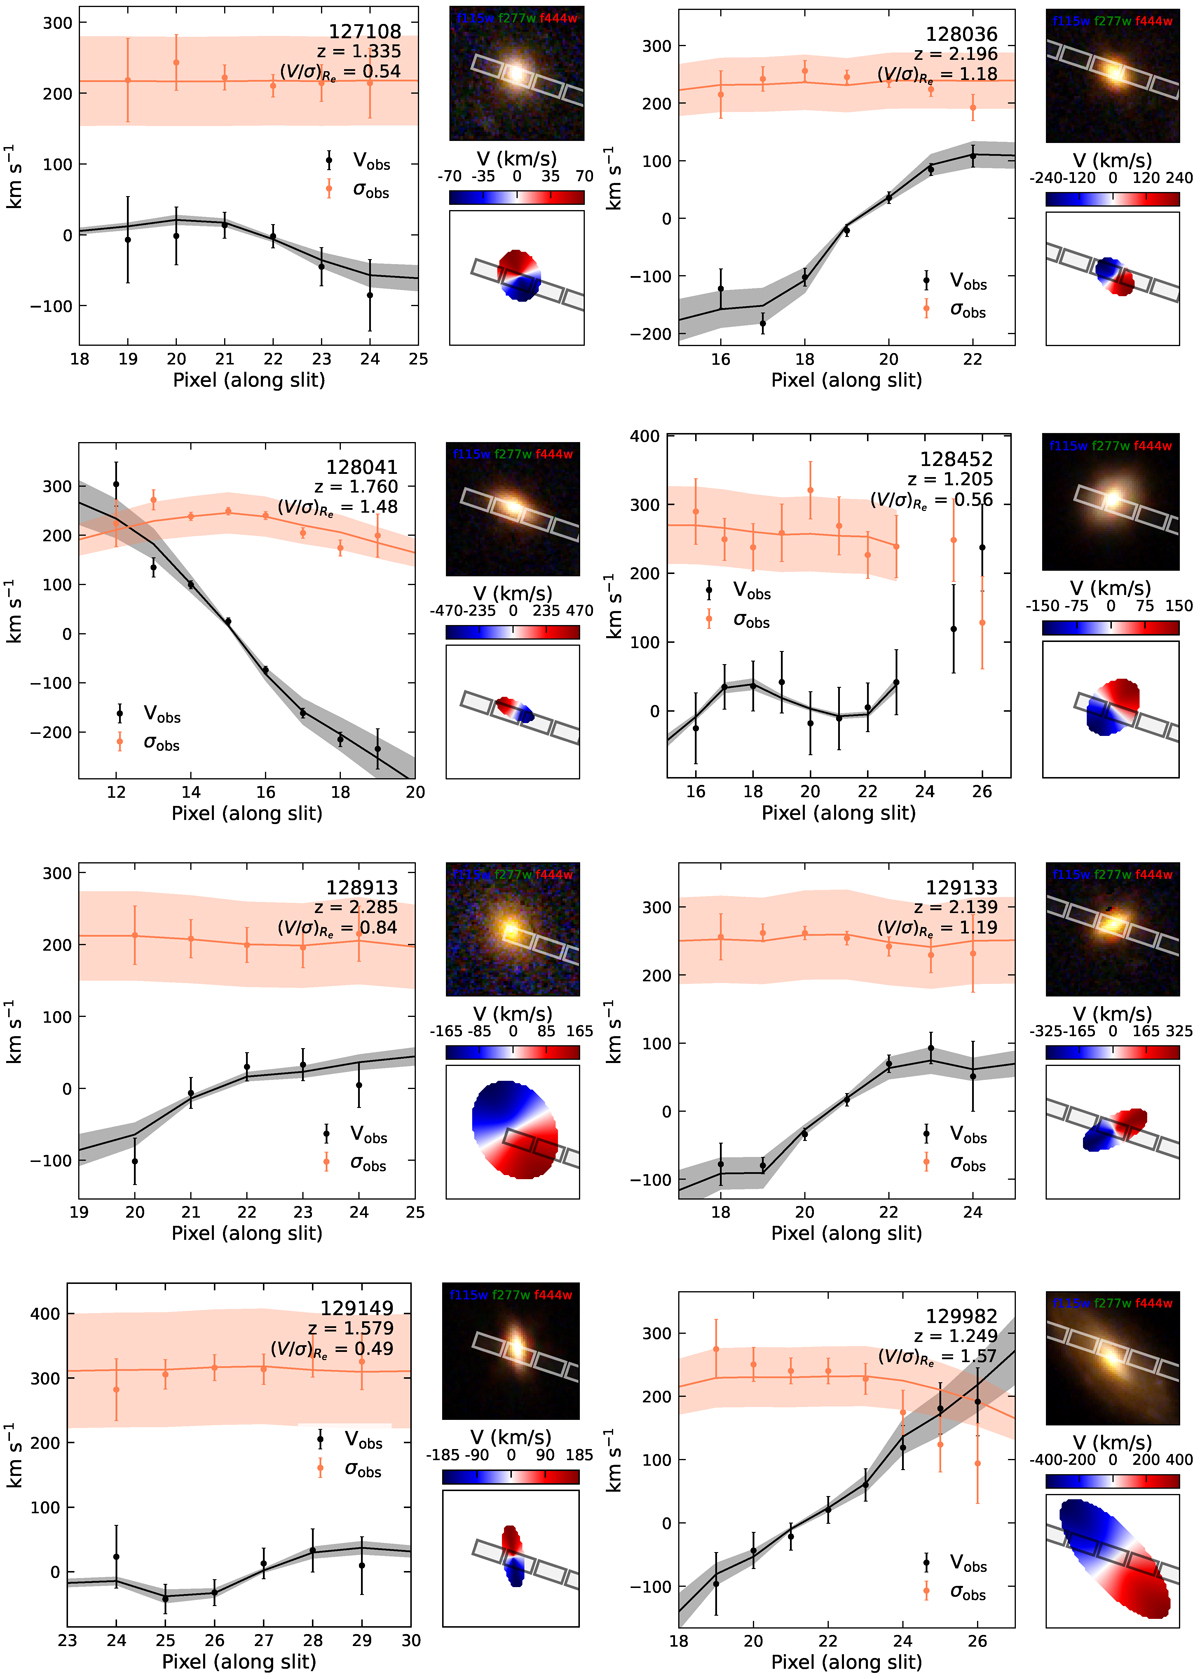
Fig. 3.
Download original image
Observed kinematics and best-fit models for the ten distant quiescent galaxies for which we can constrain rotational velocities. In the left panels, we show the observed velocities (dispersions) as the black (orange) data points, and the best-fit models are represented by the corresponding lines. In the top right panels we show NIRCam RGB imaging (Casey et al. 2023) where available, or HST F814W imaging otherwise (Scoville et al. 2007). In the bottom right panels we show the inferred 2D line of sight velocity fields. We overlay the MSA microshutter positions in both panels on the right.
Current usage metrics show cumulative count of Article Views (full-text article views including HTML views, PDF and ePub downloads, according to the available data) and Abstracts Views on Vision4Press platform.
Data correspond to usage on the plateform after 2015. The current usage metrics is available 48-96 hours after online publication and is updated daily on week days.
Initial download of the metrics may take a while.