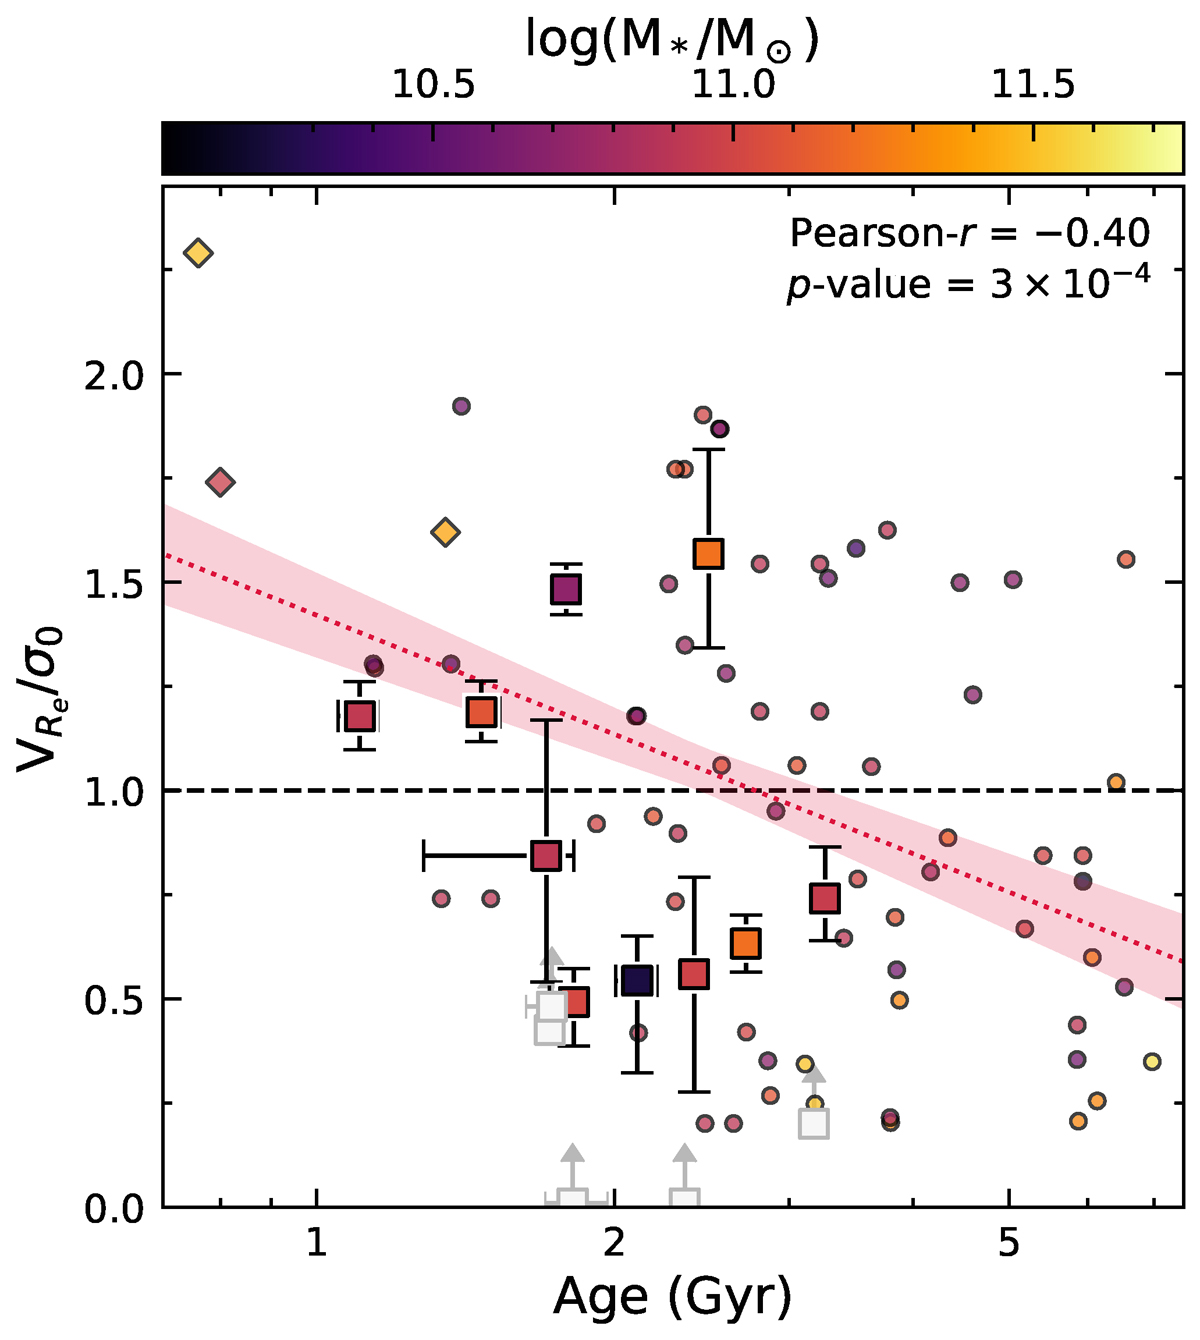
Fig. 9.
Download original image
Vre/σ0 as a function of stellar age for the distant quiescent galaxies in our sample (squares). We also include samples from literature using the same symbols as in Figure 4. The dashed black line represents a ratio of 1, corresponding to the definition of rotational support. The symbols are coloured by stellar mass. The grey squares indicate galaxies for which we can only obtain lower limits to Vre/σ0. We show the Pearson correlation coefficient and p-values in the top right. The dotted red line corresponds to a linear fit to the ages and Vre/σ0.
Current usage metrics show cumulative count of Article Views (full-text article views including HTML views, PDF and ePub downloads, according to the available data) and Abstracts Views on Vision4Press platform.
Data correspond to usage on the plateform after 2015. The current usage metrics is available 48-96 hours after online publication and is updated daily on week days.
Initial download of the metrics may take a while.