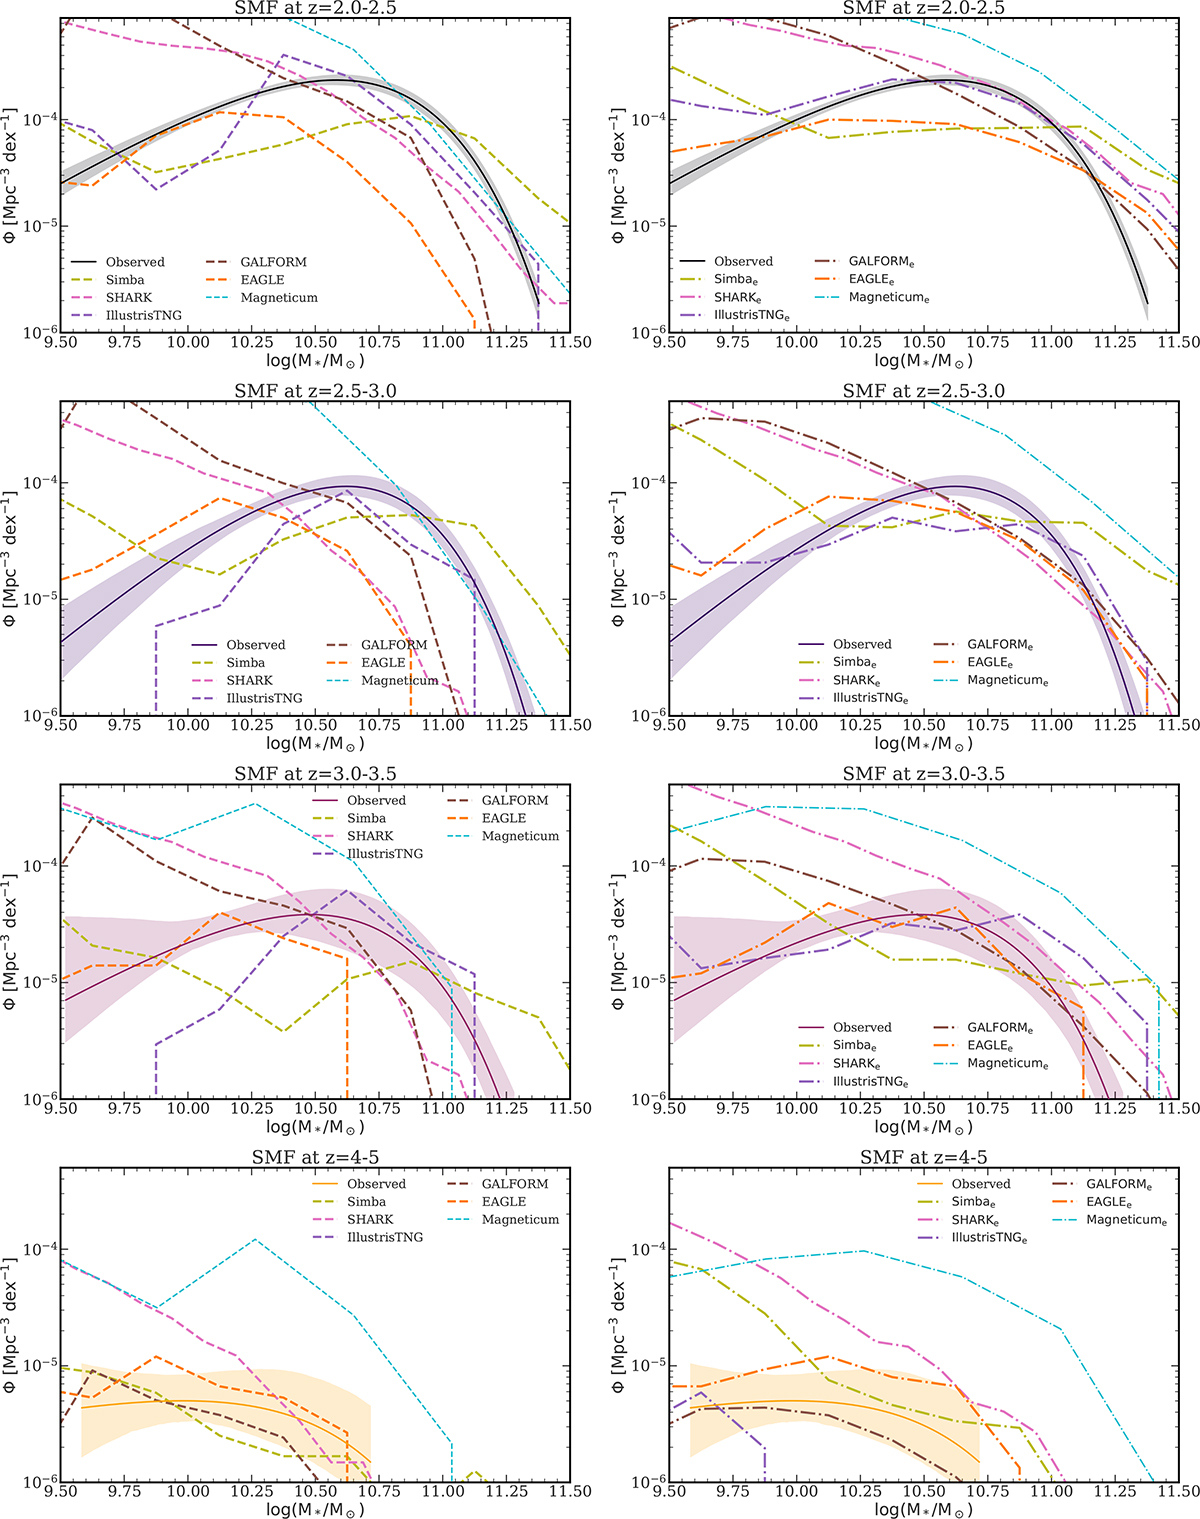
Fig. 5.
Download original image
Comparison between our observed stellar mass function (solid lines) at z = 2 − 2.5 (upper panel) z = 2.5 − 3 (upper middle panel), z = 3 − 3.5 (lower middle panel) and z = 4 − 5 (lower panel), alongside six cosmological simulations denoted by dashed lines (left hand panels, Lagos et al. 2025). The right hand panel shows the same, but with Gaussian scatter added to the stellar masses and SFRs for the six simulations. We see that the simulations cannot accurately reproduce the observed SMFs.
Current usage metrics show cumulative count of Article Views (full-text article views including HTML views, PDF and ePub downloads, according to the available data) and Abstracts Views on Vision4Press platform.
Data correspond to usage on the plateform after 2015. The current usage metrics is available 48-96 hours after online publication and is updated daily on week days.
Initial download of the metrics may take a while.