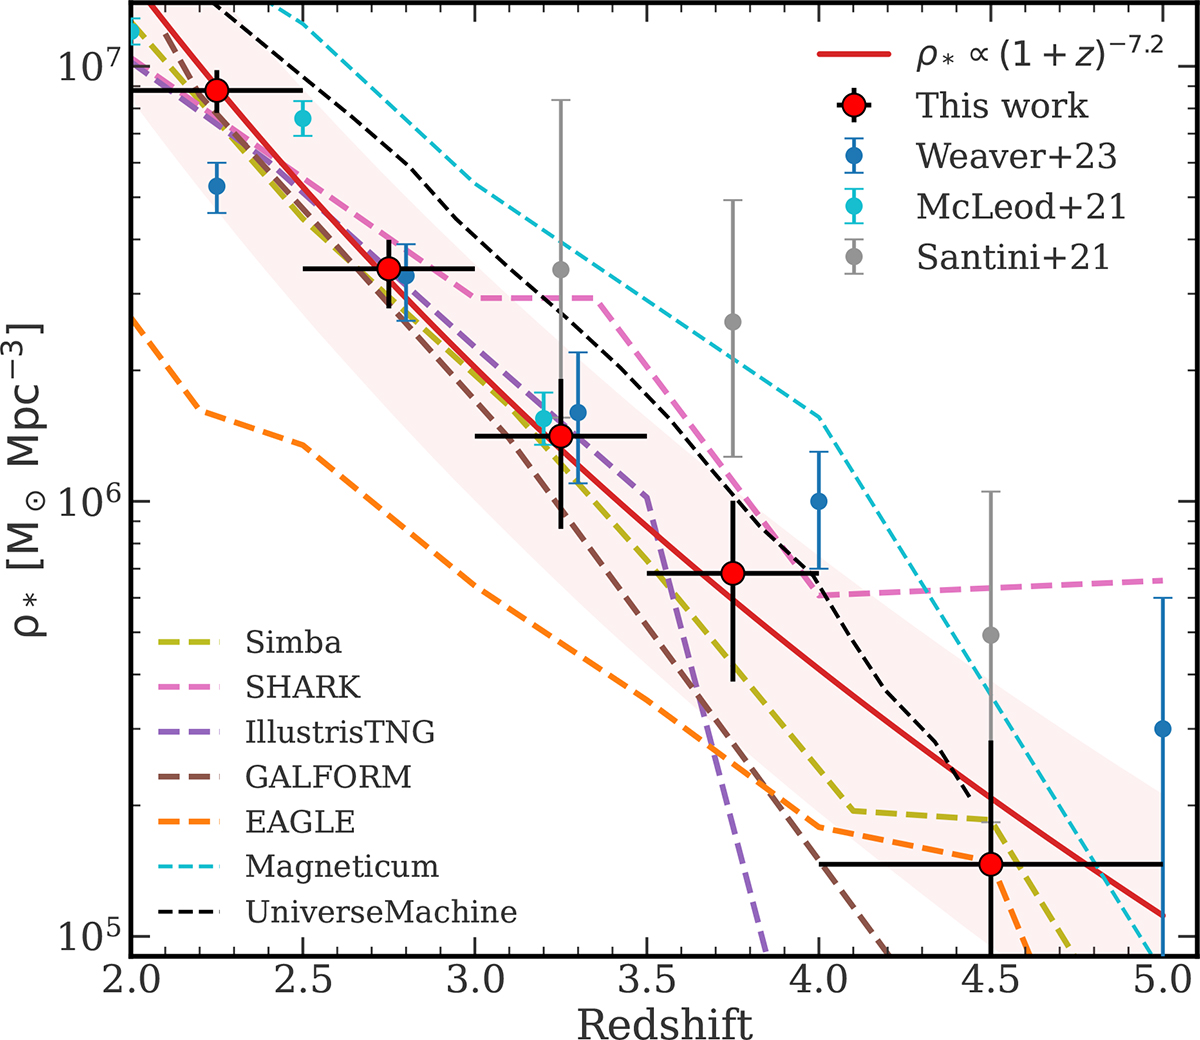
Fig. 7.
Download original image
Stellar mass density (SMD) of quiescent galaxies versus redshift based upon our best-fit SMFs (red points) with our best-fit overplotted (red line and shaded region). Also overplotted is a comparison for quiescent galaxies from Weaver et al. (2023), blue points, Santini et al. (2021), grey points, McLeod et al. (2021), light blue points, and theoretical predictions from UNIVERSEMACHINE (Behroozi et al. 2019), dashed black line. We slightly offset the z = 3.25 points for the McLeod et al. (2021) and Weaver et al. (2023) stellar mass densities in order to aid visibility within this figure. In addition, we plot SMDs from SIMBA, SHARK, ILLUSTRIS-TNG100, GALFORM, EAGLE and MAGNETICUM obtained by integrating their SMFs. We see a steeper increase in the observed SMD from z = 5 to z = 2 corresponding to ρ* ∝ (1 + z)−7.2 ± 0.3, highlighting the increasing importance of galaxy quenching over this epoch.
Current usage metrics show cumulative count of Article Views (full-text article views including HTML views, PDF and ePub downloads, according to the available data) and Abstracts Views on Vision4Press platform.
Data correspond to usage on the plateform after 2015. The current usage metrics is available 48-96 hours after online publication and is updated daily on week days.
Initial download of the metrics may take a while.