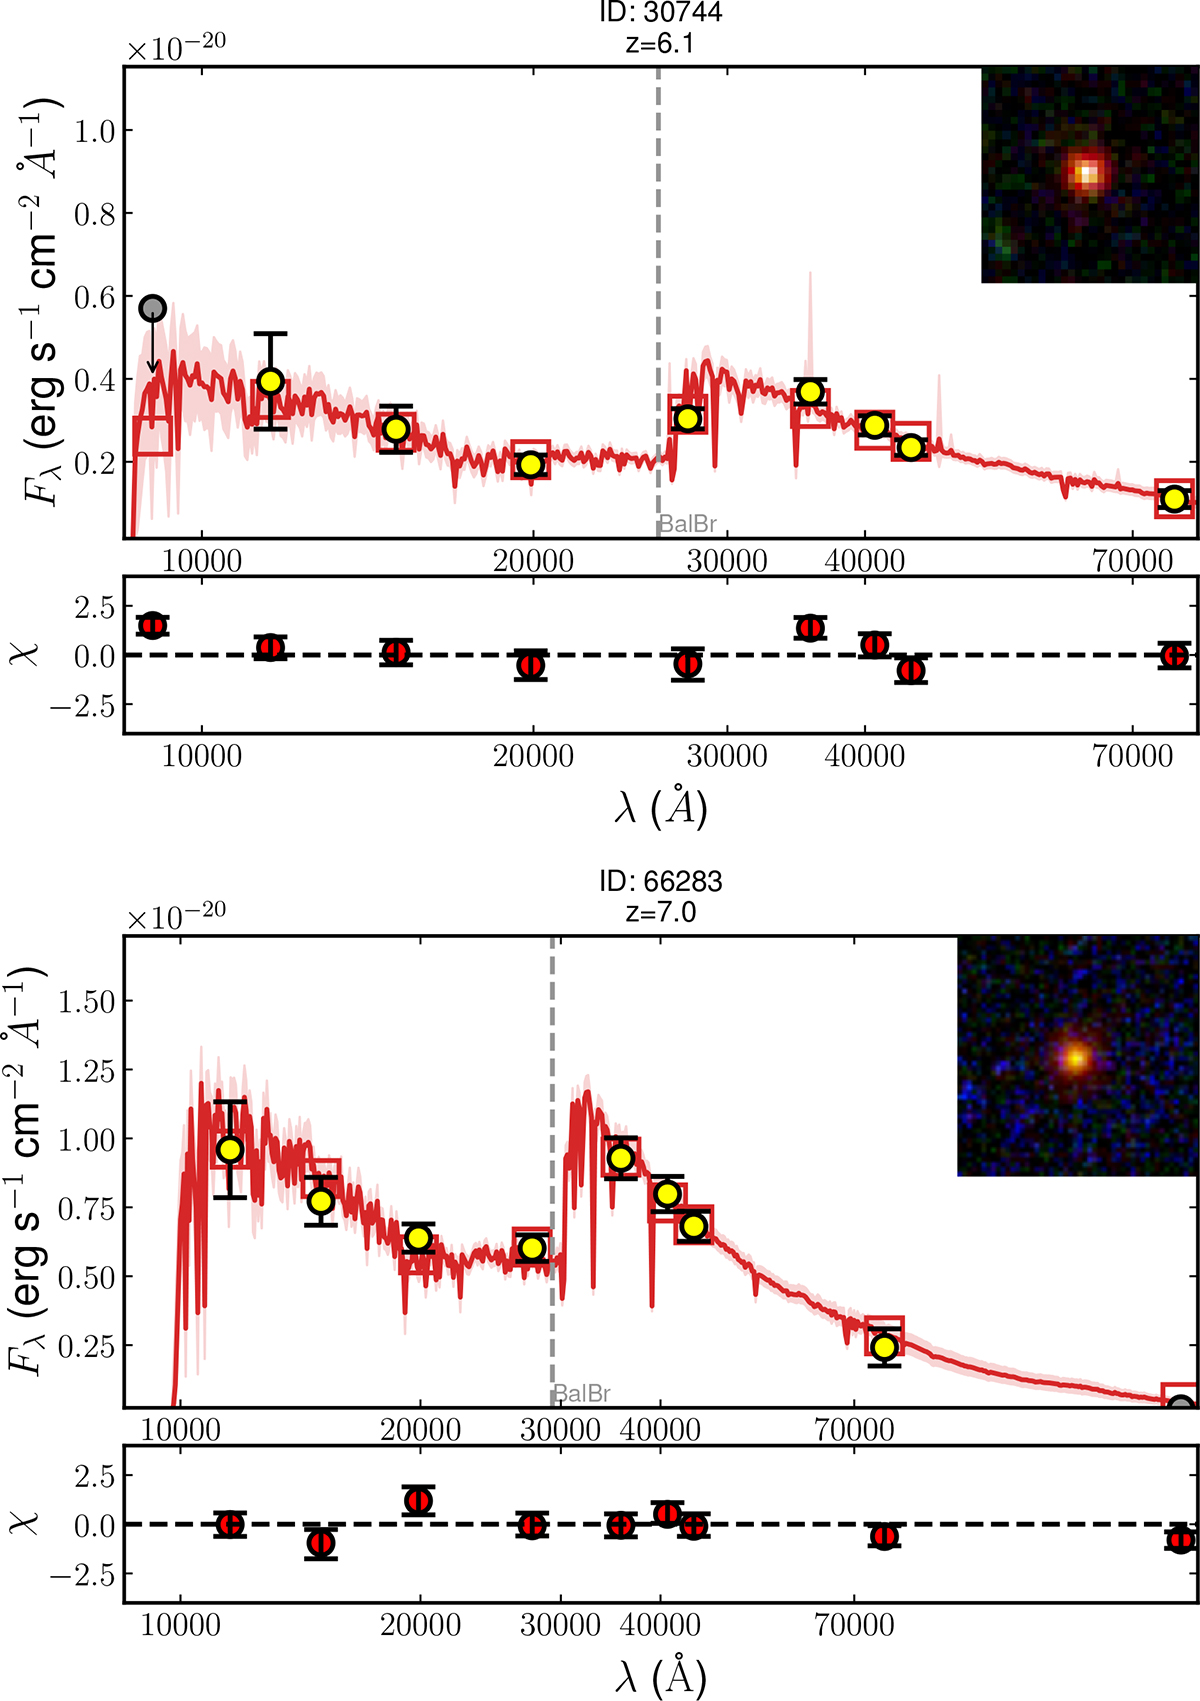
Fig. 8.
Download original image
BAGPIPES SED fits for our two highest redshift candidates (the highest-z of which is confirmed by spectroscopy Weibel et al. 2025). The yellow points are the observed photometry and the grey points correspond to non-detections with S/N < 3. The red-squares correspond to the best-fit model photometry and the red line corresponds to the best-fit model spectrum. Uncertainties in the best-fit model spectrum are denoted by the shaded regions which correspond to the 16th and 84th percentiles of the resulting distribution. An RGB image of the galaxy corresponding to F115W-F200W-F444W is included in the upper right of the figure. Both galaxies have MIRI coverage constraining the NIR part of the SED.
Current usage metrics show cumulative count of Article Views (full-text article views including HTML views, PDF and ePub downloads, according to the available data) and Abstracts Views on Vision4Press platform.
Data correspond to usage on the plateform after 2015. The current usage metrics is available 48-96 hours after online publication and is updated daily on week days.
Initial download of the metrics may take a while.