Fig. 1
Download original image
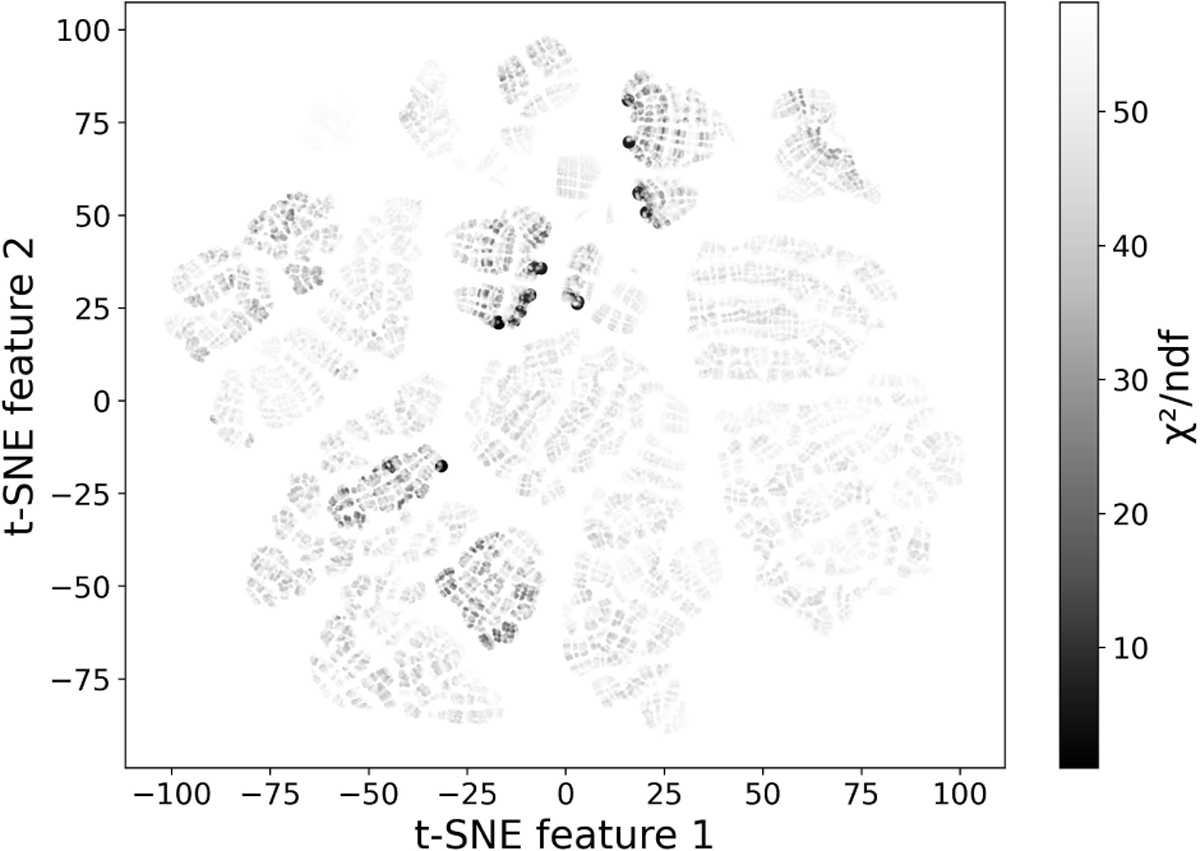
Example of the seven-dimensional parameter space mapping with t-SNE (grid scan results for simulated dataset 2, see Sect. 5.1). Each point represents one model consisting of seven parameters. Darker colors correspond to lower χ2/n.d.f. values. The plot shows the first 50000 points with the smallest χ2/n.d.f. value, and the perplexity is set to 30.
Current usage metrics show cumulative count of Article Views (full-text article views including HTML views, PDF and ePub downloads, according to the available data) and Abstracts Views on Vision4Press platform.
Data correspond to usage on the plateform after 2015. The current usage metrics is available 48-96 hours after online publication and is updated daily on week days.
Initial download of the metrics may take a while.