Open Access
Fig. 3
Download original image
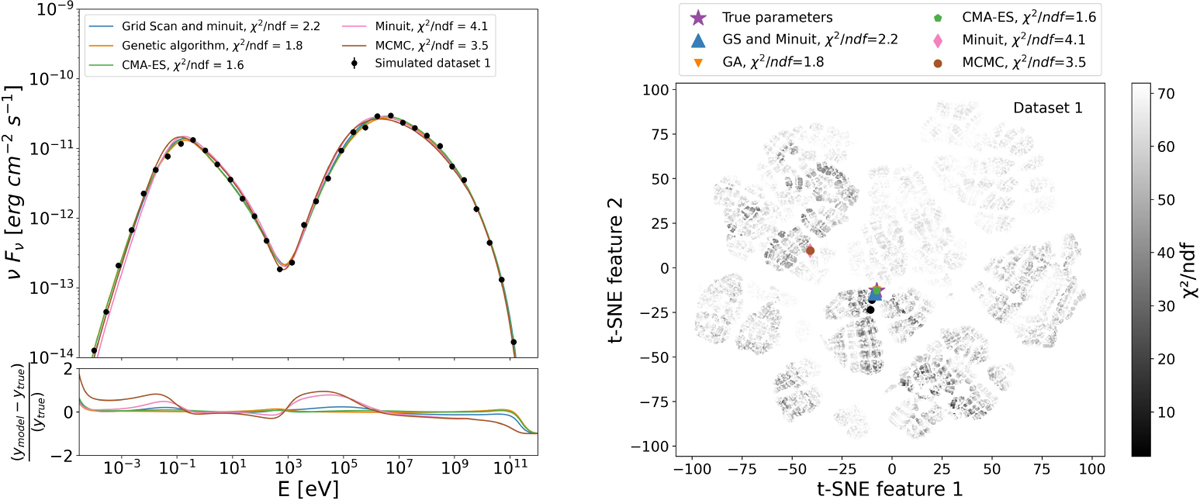
Results of the SED fitting for dataset 1. Top-left: best-fit results from all selected optimization algorithms. Bottom-left: relative deviation between the true values of νFν and those of the best-fit solutions. Right: location of the best-fit solutions in the global parameter space shown in a t-SNE map.
Current usage metrics show cumulative count of Article Views (full-text article views including HTML views, PDF and ePub downloads, according to the available data) and Abstracts Views on Vision4Press platform.
Data correspond to usage on the plateform after 2015. The current usage metrics is available 48-96 hours after online publication and is updated daily on week days.
Initial download of the metrics may take a while.