Fig. 7

Download original image
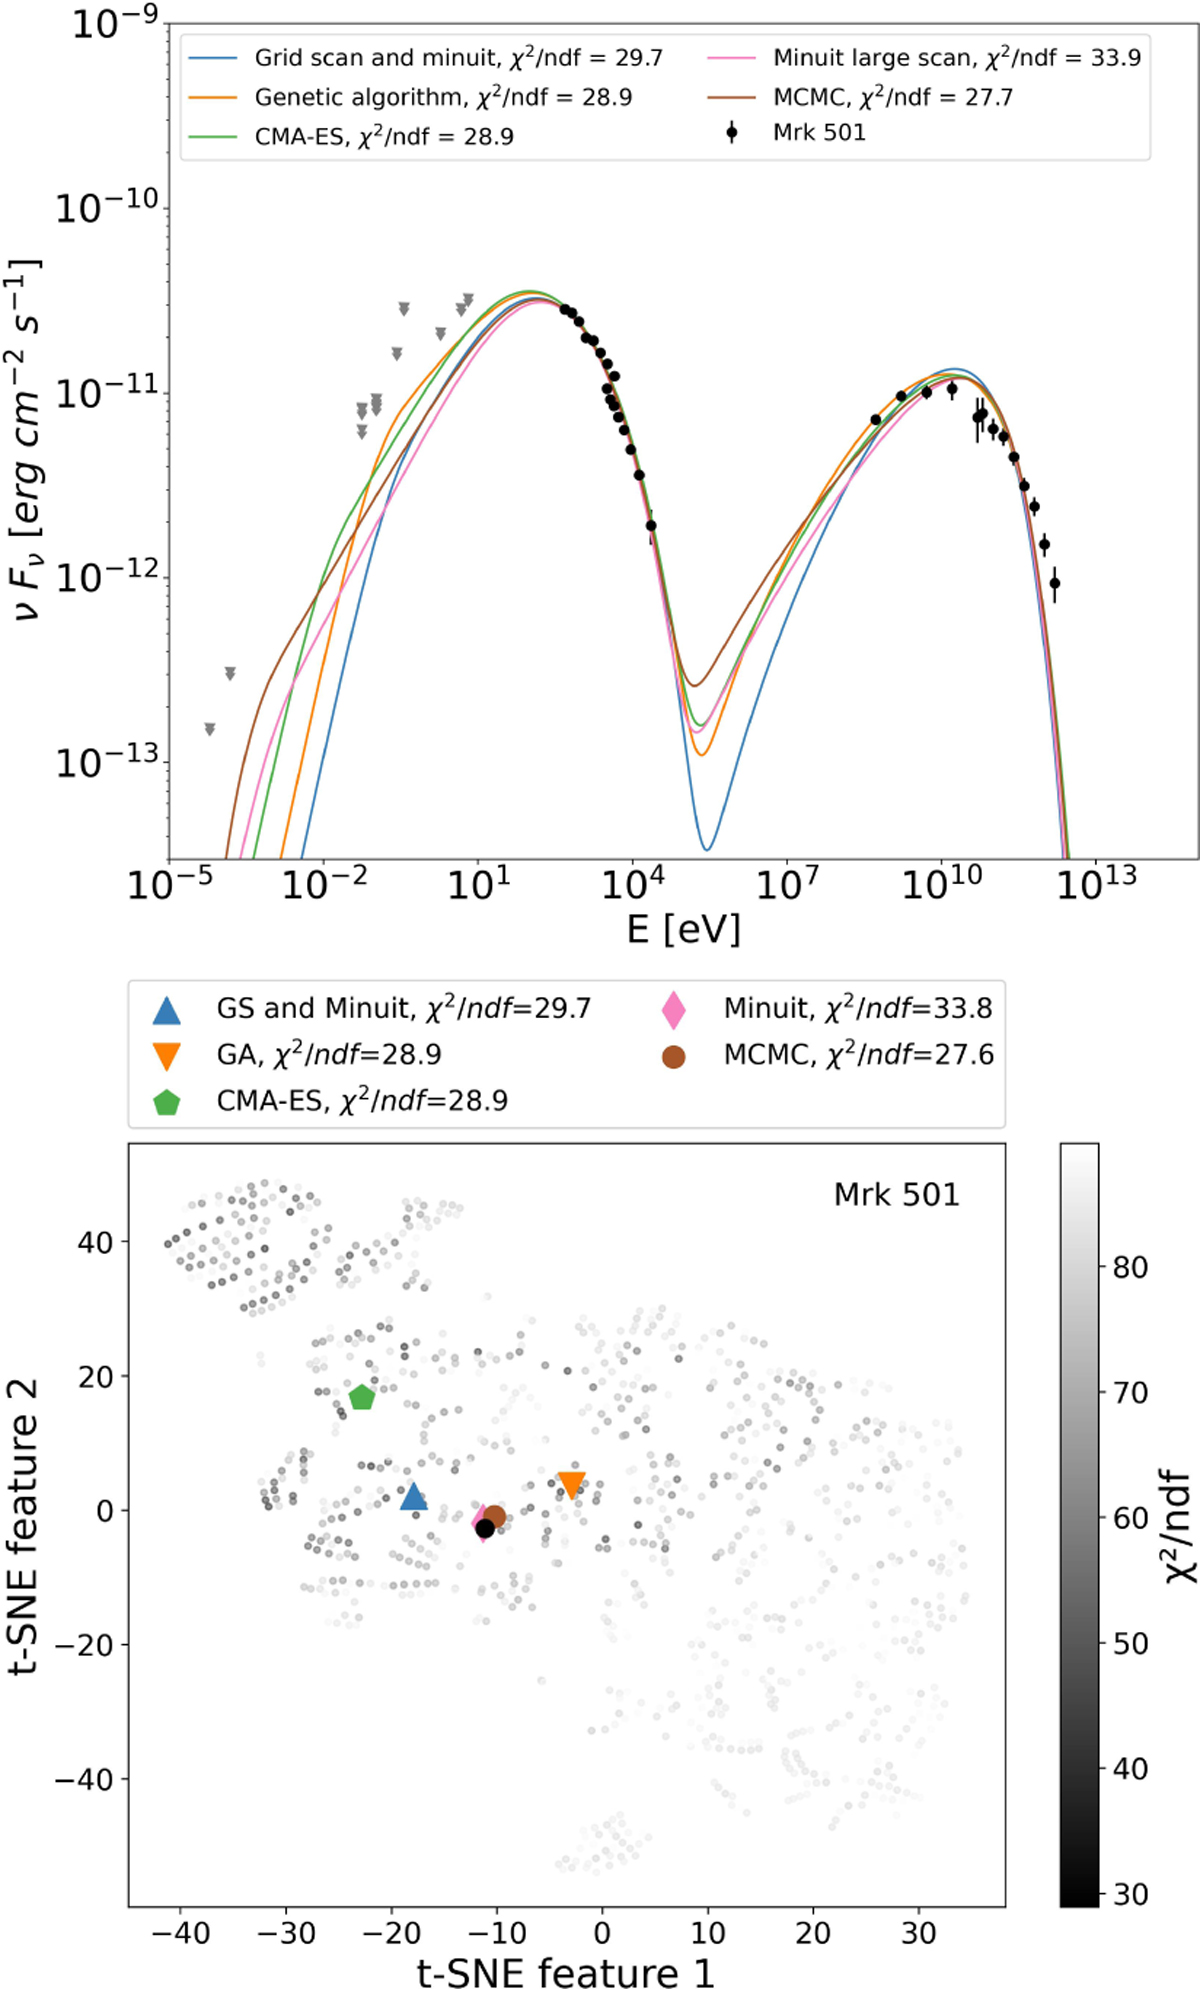
Results of the SED fitting for Mrk 501. Top: best-fit results from all selected optimization algorithms. Data used for the modeling is represented as black points while the gray triangles are treated as upper limits. The discontinuity visible within the X-ray energy range could be due to the fact that these data were measured by two different instruments. Bottom: location of the best-fit solutions in the global parameter space shown as a t-SNE map.
Current usage metrics show cumulative count of Article Views (full-text article views including HTML views, PDF and ePub downloads, according to the available data) and Abstracts Views on Vision4Press platform.
Data correspond to usage on the plateform after 2015. The current usage metrics is available 48-96 hours after online publication and is updated daily on week days.
Initial download of the metrics may take a while.


