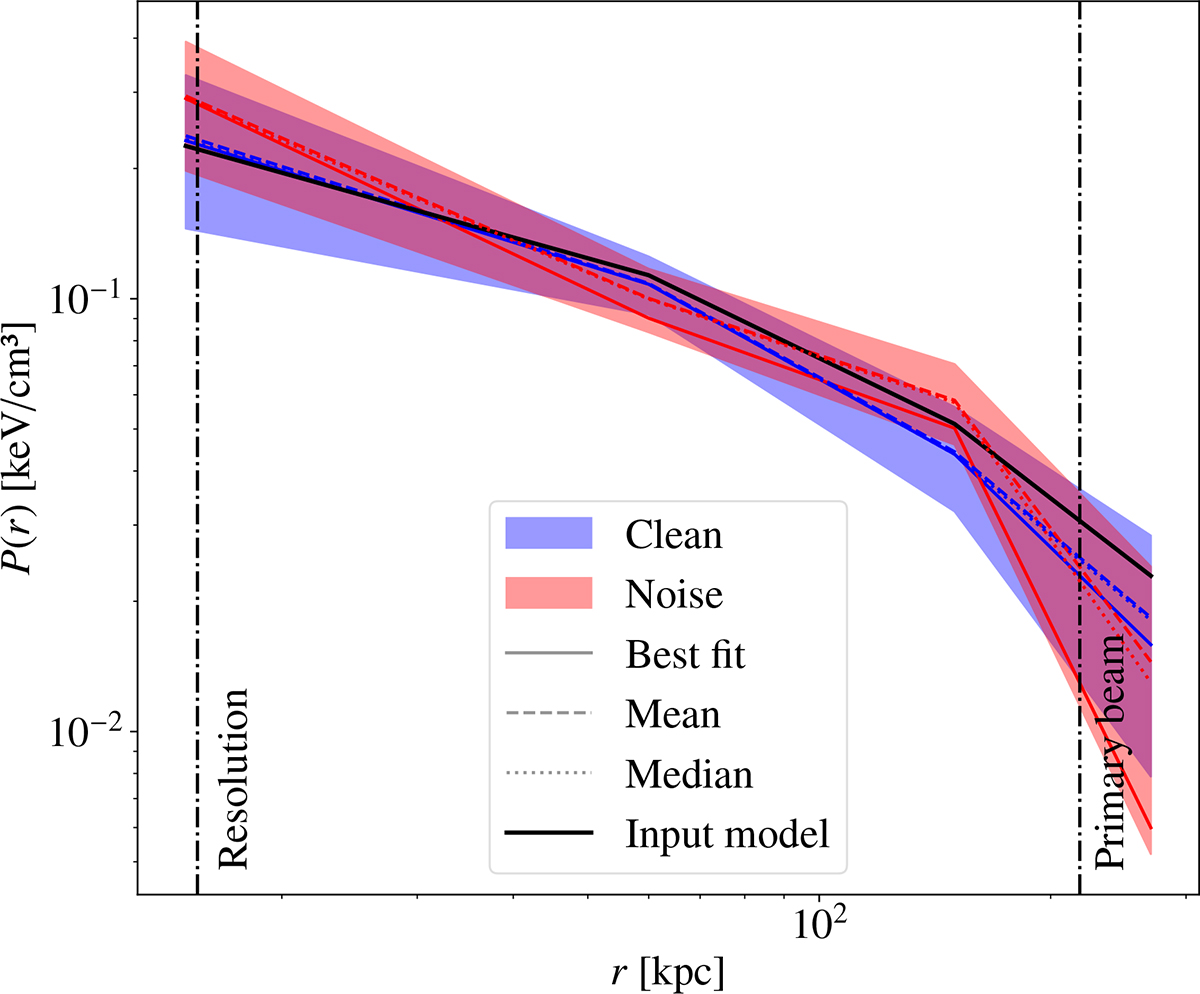
Fig. B.1.
Download original image
Pressure profiles fitted to simulated visibilities. Blue and red shaded area indicate the 16th to 84th percentiles for pressure models fitted to "Clean" and "Noise" uv tables, respectively. Solid, dashed, and dotted profiles correspond respectively to the best-fit, mean, and median values of the posterior distributions of the fitted pressure bins. The mock pressure profile used as an input model for the end-to-end test is shown in black. Vertical lines indicate the angular scales accessible to the NOEMA data.
Current usage metrics show cumulative count of Article Views (full-text article views including HTML views, PDF and ePub downloads, according to the available data) and Abstracts Views on Vision4Press platform.
Data correspond to usage on the plateform after 2015. The current usage metrics is available 48-96 hours after online publication and is updated daily on week days.
Initial download of the metrics may take a while.