Fig. 3.
Download original image
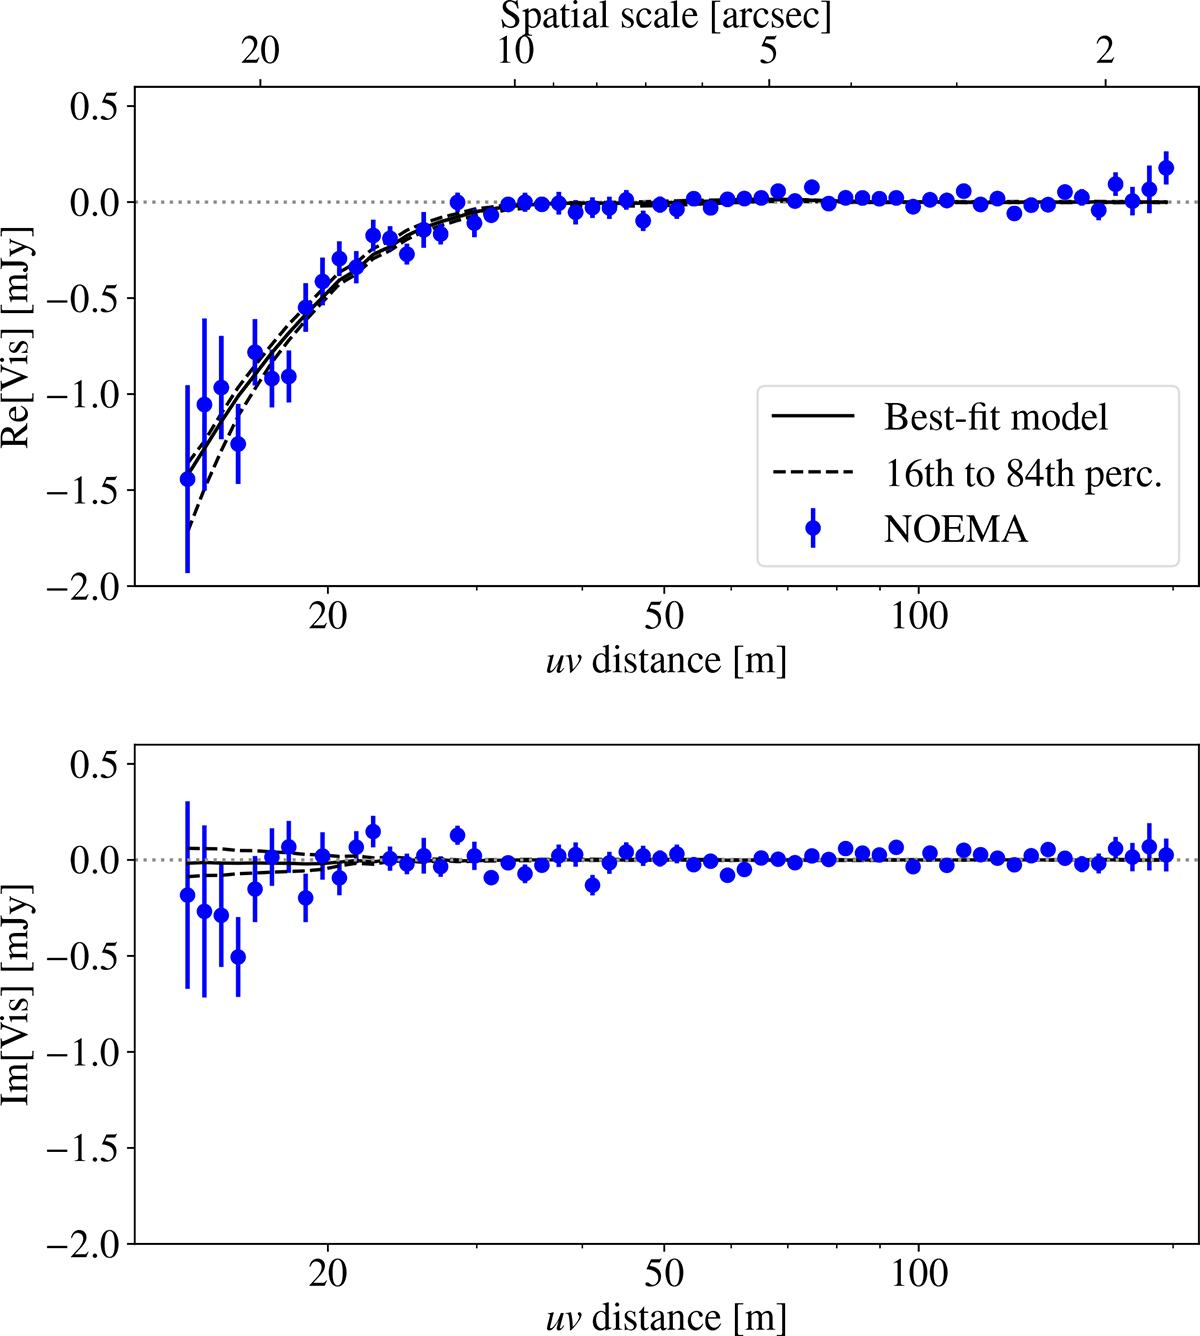
Real (top) and imaginary (bottom) visibility components as a function of binned uv distances. The blue markers show the profile for the NOEMA data after subtraction of the point sources contribution from the visibilities. The error bars indicate 1σ uncertainties propagated from the error bar associated with each visibility. The solid black lines indicate the visibility profiles corresponding to the best-fitting model to the NOEMA data. The dashed black lines show the 16th to 84th percentiles of the fitted model.
Current usage metrics show cumulative count of Article Views (full-text article views including HTML views, PDF and ePub downloads, according to the available data) and Abstracts Views on Vision4Press platform.
Data correspond to usage on the plateform after 2015. The current usage metrics is available 48-96 hours after online publication and is updated daily on week days.
Initial download of the metrics may take a while.