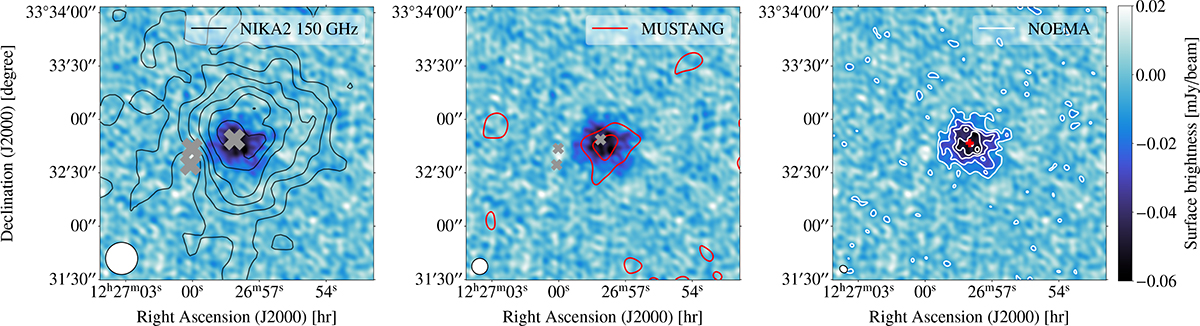
Fig. 4.
Download original image
Point-source-subtracted and cleaned continuum NOEMA map of CL J1226.9+3332 compared to NIKA2 and MUSTANG observations. Left: NIKA2 150 GHz (Muñoz-Echeverría et al. 2023) contours (black) starting from 2σ and spaced by 2σ. The 18″ beam is indicated in the lower left corner. Centre: MUSTANG 90 GHz (Romero et al. 2018) contours (red) starting from 2σ and spaced by 2σ with the beam (9″) in the lower left corner. Right: 2σ levels in the NOEMA map (white). The size and orientation of NOEMA’s synthesized beam (4.6″ × 3.8″ at PA = 54°) are indicated in the lower left corner. The red cross indicates the centre of the map as defined from the tSZ peak according to NOEMA data (Table 1). The grey crosses in left and central panels show the positions of the three sources we subtracted from the NOEMA data, but not from NIKA2 and MUSTANG to calculate contours.
Current usage metrics show cumulative count of Article Views (full-text article views including HTML views, PDF and ePub downloads, according to the available data) and Abstracts Views on Vision4Press platform.
Data correspond to usage on the plateform after 2015. The current usage metrics is available 48-96 hours after online publication and is updated daily on week days.
Initial download of the metrics may take a while.