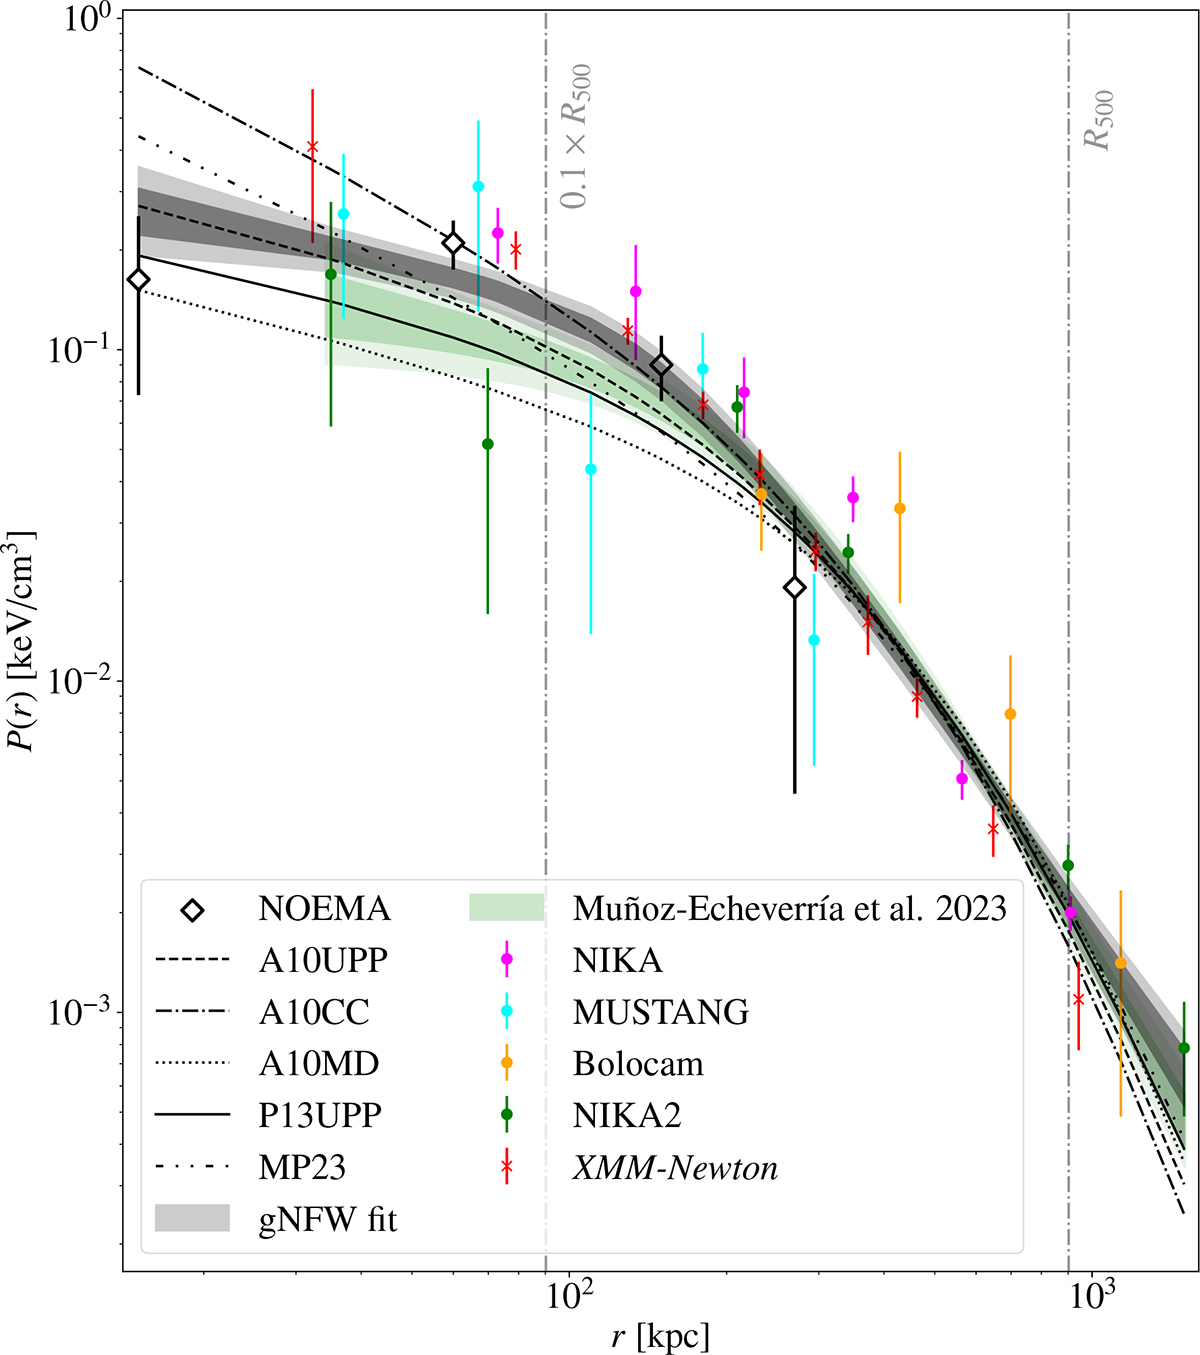
Fig. 7.
Download original image
Pressure profile of CL J1226.9+3332. The empty black diamonds indicate the best pressure profile bins fitted to NOEMA visibilities. The magenta, blue, and orange markers show the profiles reconstructed by Romero et al. (2018) for NIKA, MUSTANG, and Bolocam data, respectively. The green markers correspond to the NIKA2 pressure reconstruction from Muñoz-Echeverría et al. (2023). The pressure profile reconstructed from XMM-Newton X-ray observations (Muñoz-Echeverría et al. 2023) is shown in red. The error bars represent the square root of the diagonal elements of the covariance matrix. The grey shaded areas indicate the 16th to 84th and 2.5th to 97.5th percentiles for the gNFW pressure profile we fitted to all tSZ pressure bins. In green, we present the gNFW profile obtained by Muñoz-Echeverría et al. (2023) without NOEMA data and neglecting the correlation of the pressure bins from Romero et al. (2018). The dashed, dash-dotted, and dotted lines correspond to the universal, cool-core, and morphologically disturbed pressure profiles from Arnaud et al. (2010), respectively. The solid and dash-dot-dotted profiles show the pressure profiles obtained by Planck Collaboration V (2013) and Melin & Pratt (2023), respectively. The vertical dashed-dotted grey lines indicate the 0.1 × R500 and R500 characteristic radii of the cluster.
Current usage metrics show cumulative count of Article Views (full-text article views including HTML views, PDF and ePub downloads, according to the available data) and Abstracts Views on Vision4Press platform.
Data correspond to usage on the plateform after 2015. The current usage metrics is available 48-96 hours after online publication and is updated daily on week days.
Initial download of the metrics may take a while.