Fig. 3
Download original image
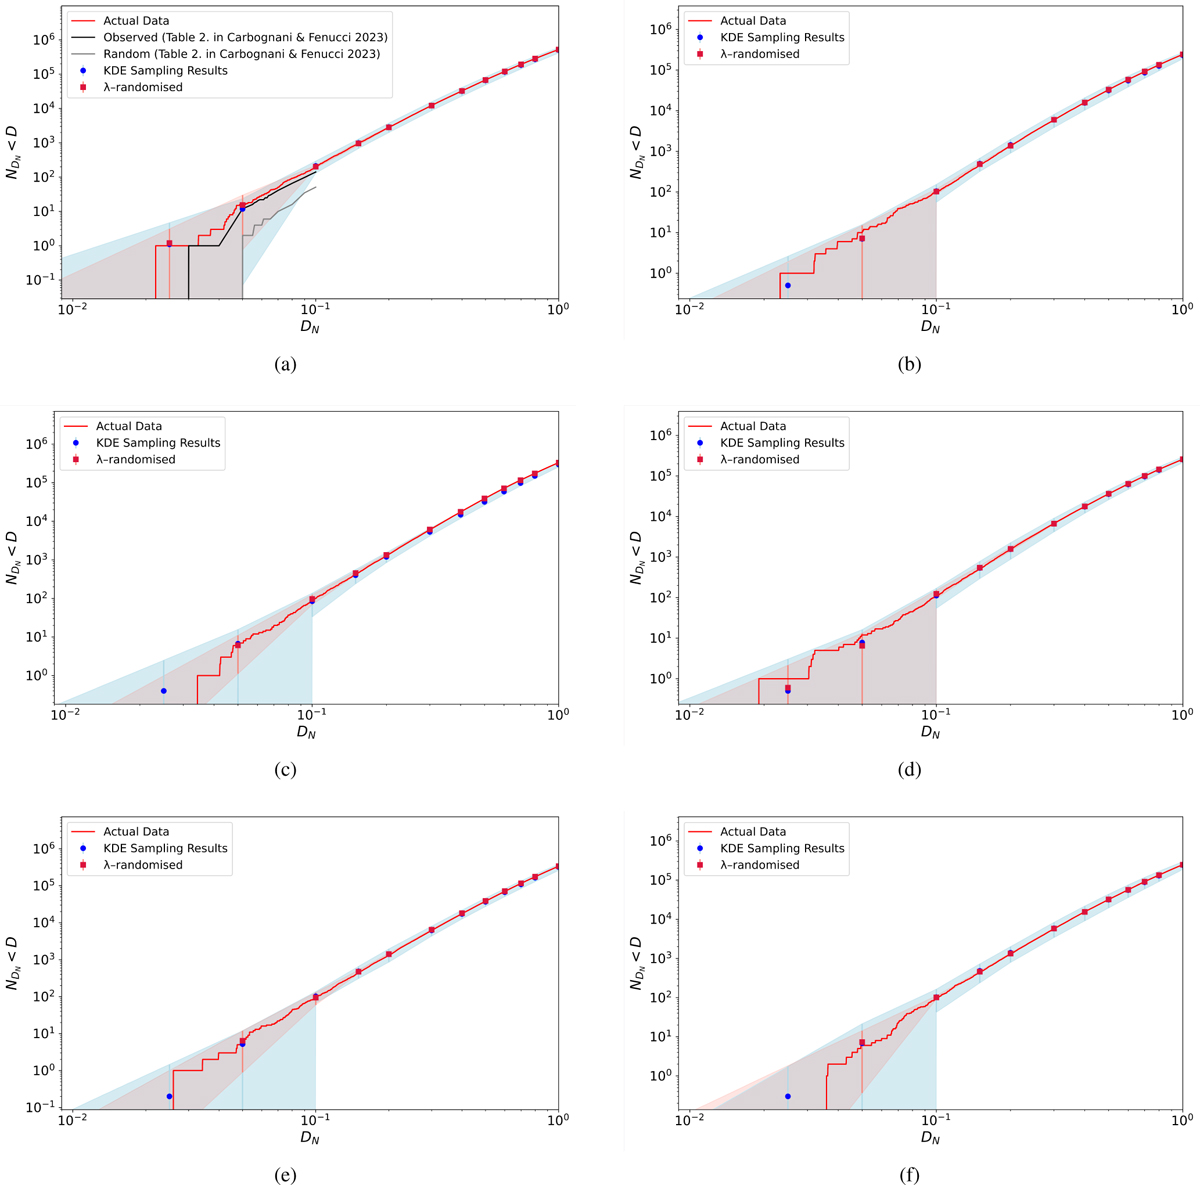
CSDs of the 46 recovered meteorite falls and NEA theoretical impact radiants: NEODyS-2 (a), Method A (b), Method B (c), Method H (d), Method Q (e), and Method W (f). The red curve, labelled ‘Actual Data’, represents the cumulative similarity between every possible radiant–fall pair combination for the 46 falls and the theoretical NEA radiants of a particular method. The NEA radiants were estimated using six different methods, one for each panel. Two sporadic association regions are estimated. The blue region encompasses the 3σ confidence region for random associations based on the KDE-drawn samples. The red region represents the 3σ confidence region for random associations based on a uniformly random λ⊙. In panel a, the ‘observed’ and ‘random’ curves reported by Carbognani & Fenucci (2023) are also included for comparison purposes.
Current usage metrics show cumulative count of Article Views (full-text article views including HTML views, PDF and ePub downloads, according to the available data) and Abstracts Views on Vision4Press platform.
Data correspond to usage on the plateform after 2015. The current usage metrics is available 48-96 hours after online publication and is updated daily on week days.
Initial download of the metrics may take a while.