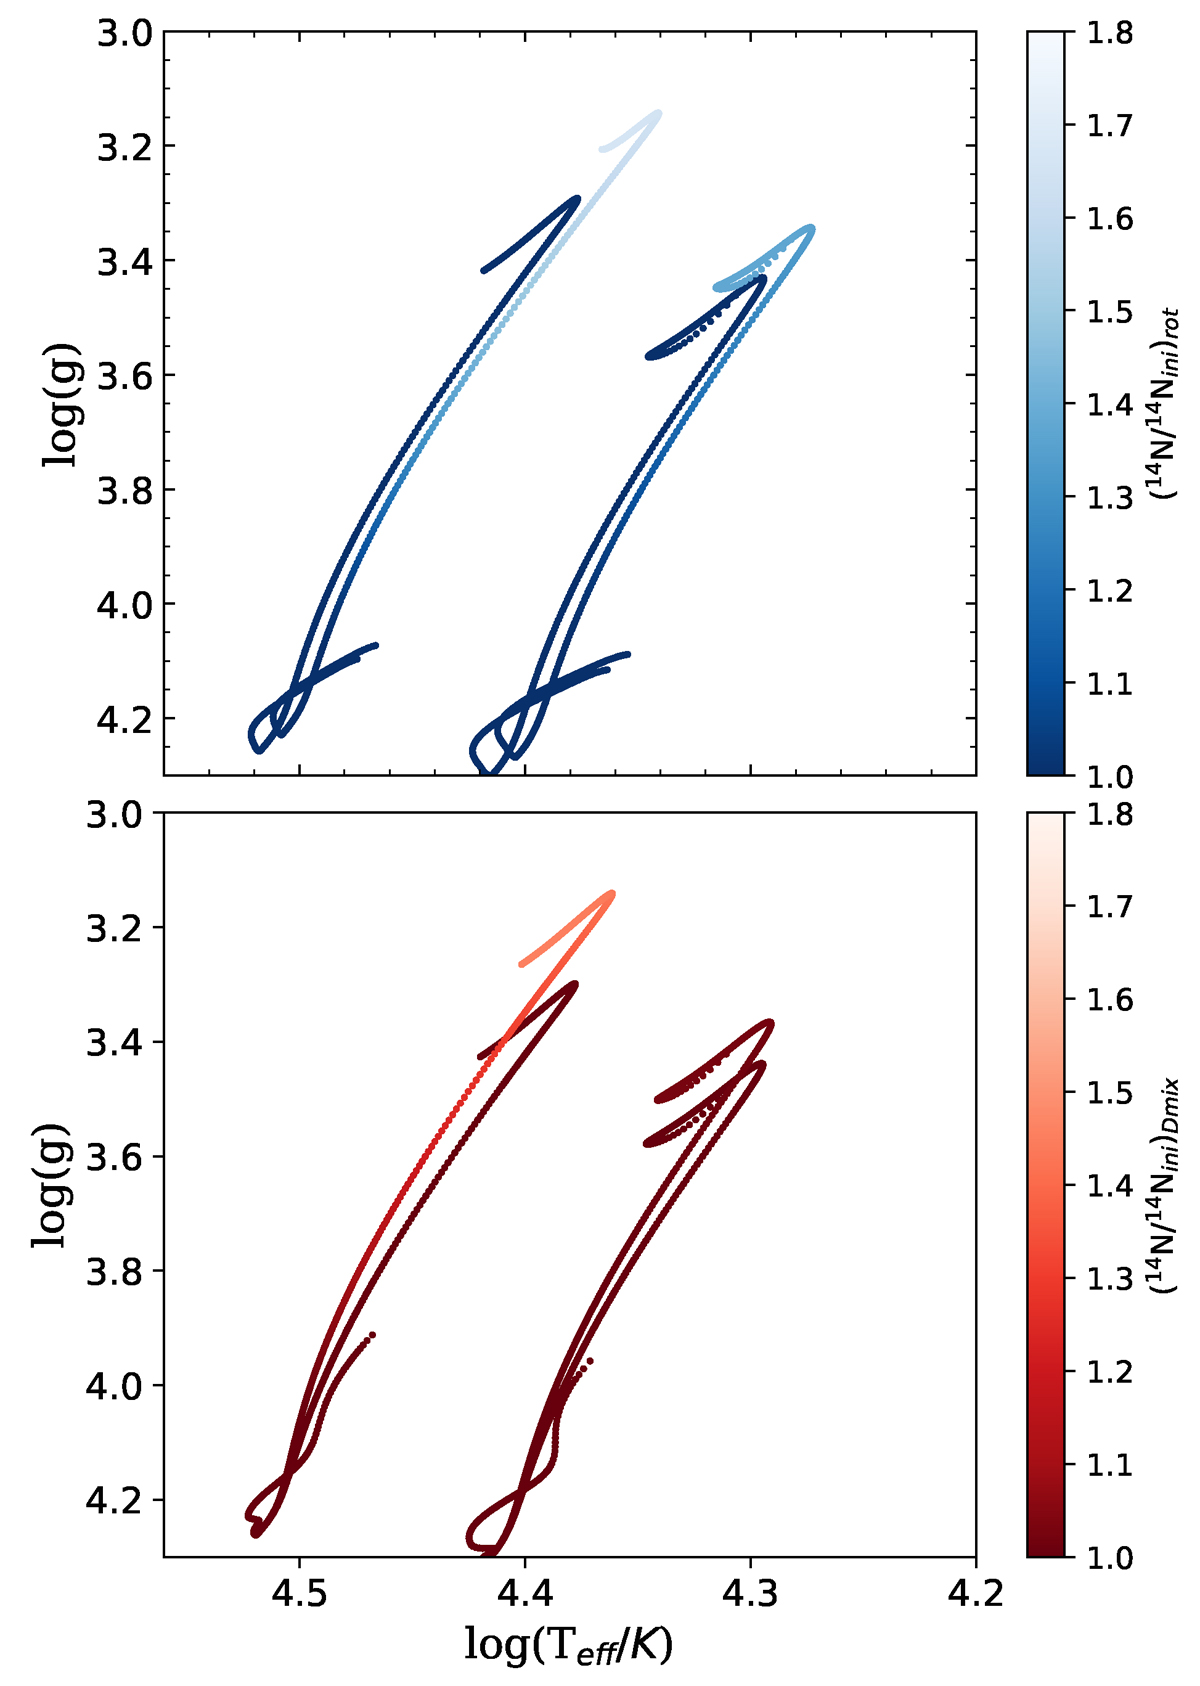
Fig. 4.

Download original image
Tracks in the Kiel diagram of 10 M⊙ (right) and 17 M⊙ (left) models, with the surface nitrogen compared to the initial surface abundance on the color scale, minding the fact that a lighter color indicates a larger amount of nitrogen on the surface. The top panel shows models with different levels of initial rotational velocity (blue scale), where the models of either set on the left side have an an initial rotational velocity of 15% of the critical rotational velocity; whereas the models on the right have initial rotational velocity 40% of the critical rotational velocity. These models do not include mixing based on IGWs. The bottom panel shows the models with different levels of envelope mixing based on IGWs and do not include the effects of rotational mixing. The tracks that branch off to lower log(g) are those with log(Denv/cm2 s−1) = 5 for the 10 M⊙ model and log(Denv/cm2 s−1) = 6 for the 17 M⊙ model. The other two tracks have log(Denv/cm2 s−1) = 0.
Current usage metrics show cumulative count of Article Views (full-text article views including HTML views, PDF and ePub downloads, according to the available data) and Abstracts Views on Vision4Press platform.
Data correspond to usage on the plateform after 2015. The current usage metrics is available 48-96 hours after online publication and is updated daily on week days.
Initial download of the metrics may take a while.


