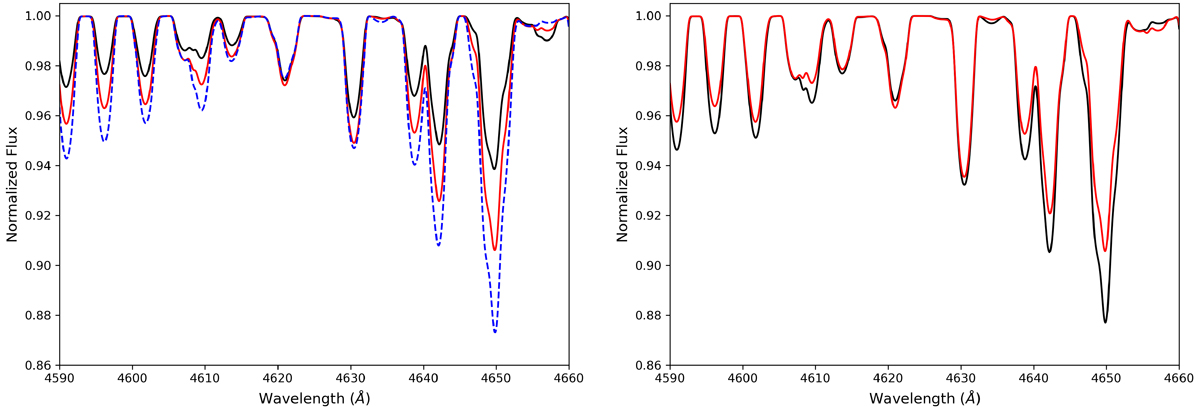
Fig. 8.
Download original image
Effect of variations in atmospheric parameters on nitrogen lines in the atmosphere of a V380 Cyg-like star. Left: Black, red, and blue lines represent effective temperatures of 18 500 K, 20 000 K, and 21 500 K, respectively. Right: Black and red lines show the effect of changing the microturbulent velocity in the atmospheric model from 15 km s−1 to 2 km s−1, respectively.
Current usage metrics show cumulative count of Article Views (full-text article views including HTML views, PDF and ePub downloads, according to the available data) and Abstracts Views on Vision4Press platform.
Data correspond to usage on the plateform after 2015. The current usage metrics is available 48-96 hours after online publication and is updated daily on week days.
Initial download of the metrics may take a while.