Fig. 1.
Download original image
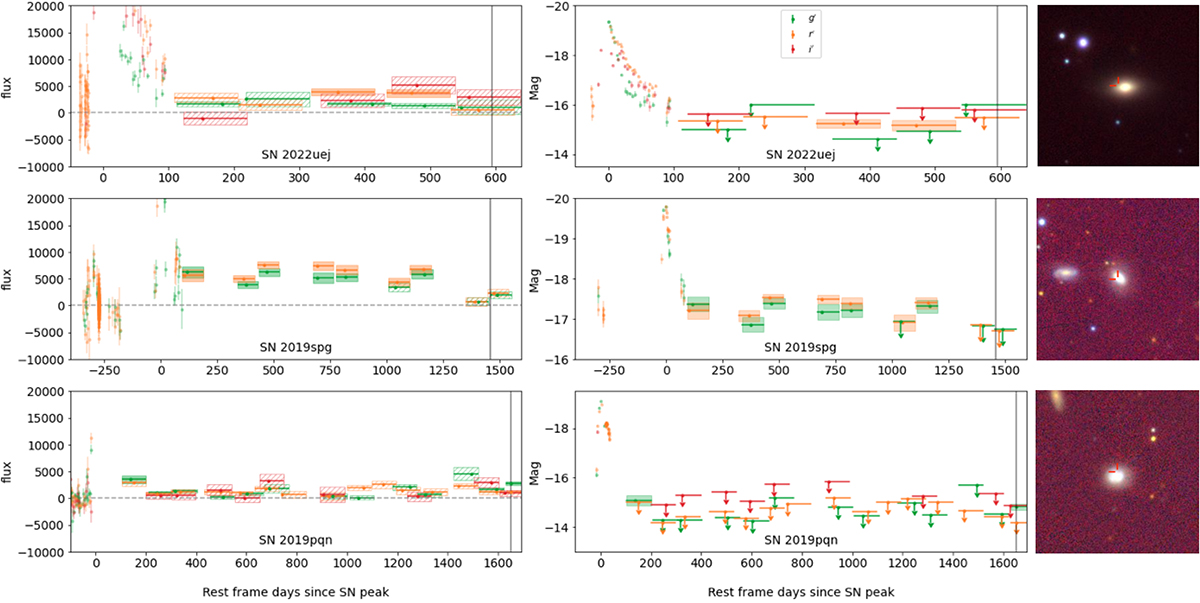
Left: Binned light curves in flux space in the SN rest-frame of the three objects with a late time signal that we were not able to follow up on. The three ZTF bands g, r, and i are shown in green, orange, and red, respectively. Individual observations are shown before the binning starts. Bins are shown as coloured blocks showing the size of the bin, mean value, and 1σ uncertainty of the binned observations, with the point showing the mean observation date of the bin. Bins that are > 5σ above zero flux are filled, and bins ≤5σ from zero flux are dashed. Middle: Same plot as on the left but in absolute magnitude, corrected for MW extinction. 5σ detections in individual observations are shown before the binning starts, and the 5σ binned detections are shown in the same way as in the left plots. 5σ upper limits are shown with a downward arrow for the binned non-detections. The gray vertical line shows when the excess was first discovered. Right: PS1 cutouts centred on the SN location, which is marked in red.
Current usage metrics show cumulative count of Article Views (full-text article views including HTML views, PDF and ePub downloads, according to the available data) and Abstracts Views on Vision4Press platform.
Data correspond to usage on the plateform after 2015. The current usage metrics is available 48-96 hours after online publication and is updated daily on week days.
Initial download of the metrics may take a while.