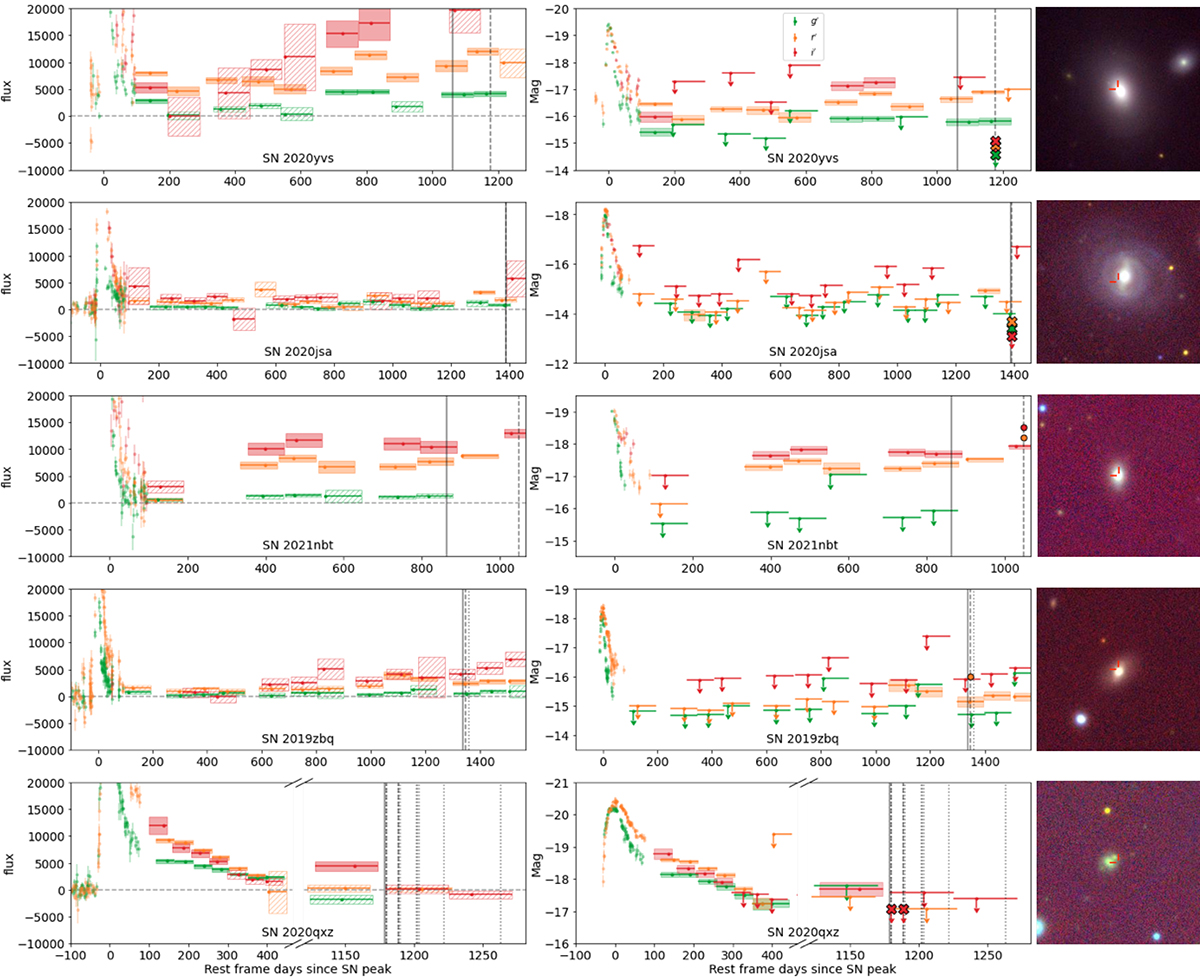
Fig. 2.
Download original image
Same as Fig. 1, but for the objects with follow-up observations. The grey vertical line shows when the excess was first discovered, and the grey dashed and dotted vertical lines show the photometric and spectroscopic follow-up observations, respectively. The coloured points at the follow-up dates show the follow-up detections and the crosses show the follow-up 5σ upper limits. Note: for SN 2020qxz, the time period between the SN tail and late-time signal has been cut out to better show the detections and follow-up campaign.
Current usage metrics show cumulative count of Article Views (full-text article views including HTML views, PDF and ePub downloads, according to the available data) and Abstracts Views on Vision4Press platform.
Data correspond to usage on the plateform after 2015. The current usage metrics is available 48-96 hours after online publication and is updated daily on week days.
Initial download of the metrics may take a while.