Fig. 5.
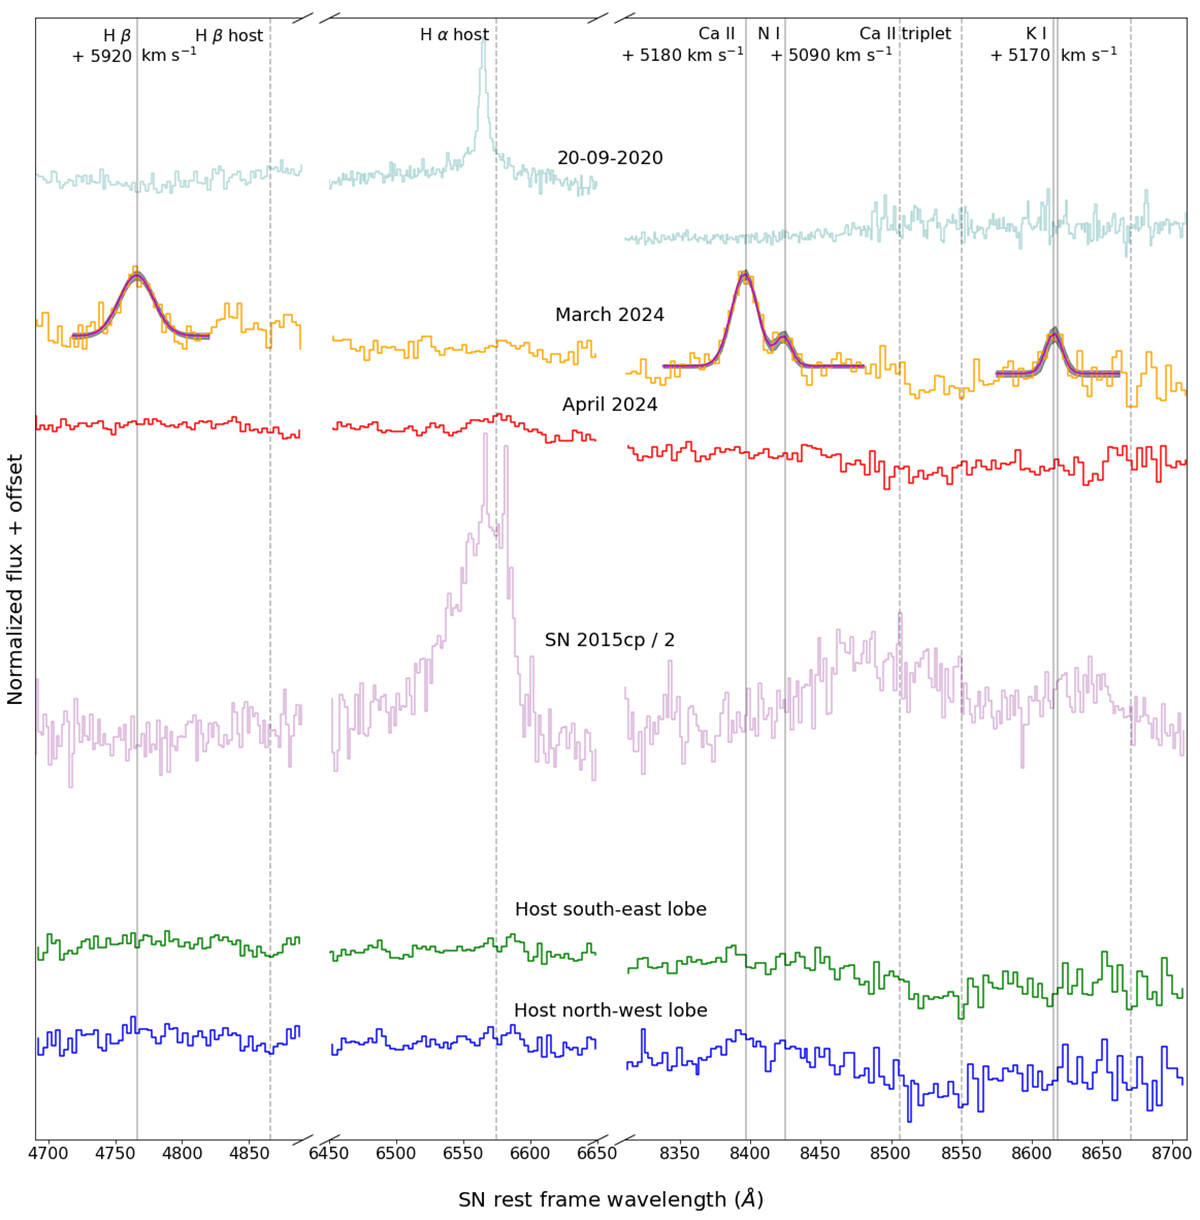
Download original image
Combined late-time spectra of SN 2020qxz and its host in the SN rest-frame, zoomed in on the regions containing the transient emission lines and the Hα region. The transient emission lines are marked with grey vertical lines, and the best-fit Gaussians are overlaid on top of the combined March spectrum with the 1σ uncertainties of the Gaussian fits shown in grey. The dashed vertical lines show the location of host galaxy lines (as well as Hβ to compare its location to the transient emission line) at the host redshift of z = 0.0975. We also show the classification spectrum of SN 2020qzx taken around peak magnitude in light blue and the late-time spectrum obtained for SN 2015cp in magenta, scaled down by a factor of 2 for readability.
Current usage metrics show cumulative count of Article Views (full-text article views including HTML views, PDF and ePub downloads, according to the available data) and Abstracts Views on Vision4Press platform.
Data correspond to usage on the plateform after 2015. The current usage metrics is available 48-96 hours after online publication and is updated daily on week days.
Initial download of the metrics may take a while.