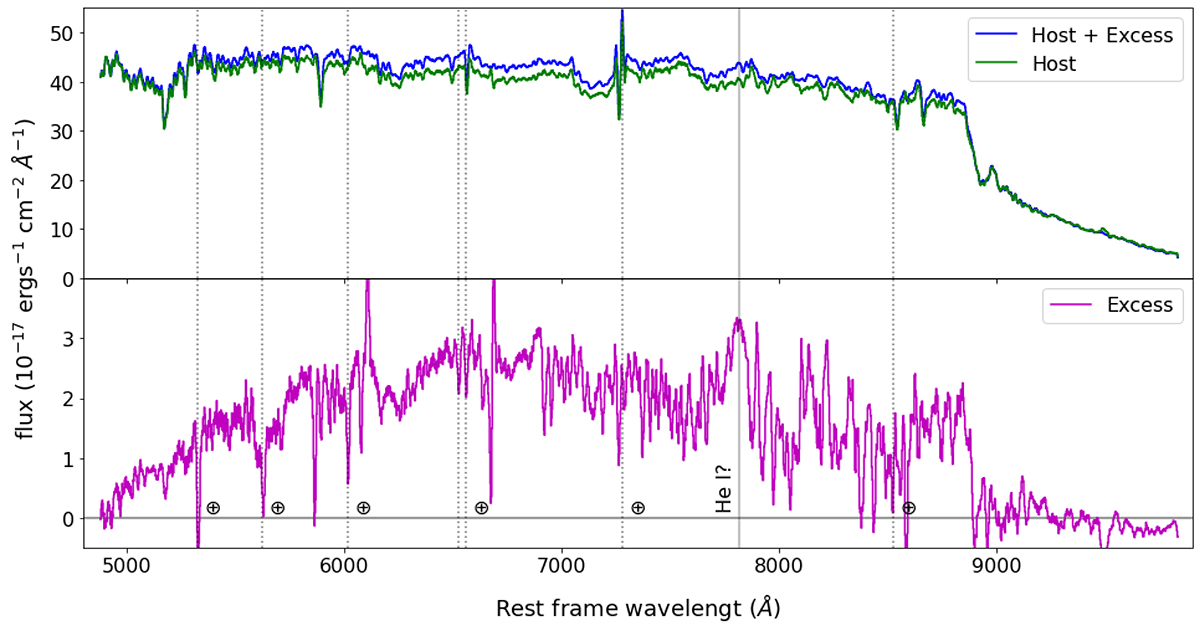
Fig. B.1.
Download original image
GTC spectrum of the transient in the SN 2019zbq host galaxy, taken on 4 December 2019. Vertical dotted lines give the locations of sky lines and tellurics. Top: Extracted spectra at the centre of the trace (host + excess) and at the side of the extended host galaxy trace (host). The sharp decline around 9000 Å is due to the low sensitivity of the detector at these wavelengths, and has been used to scale the spectra such that their difference goes to 0. Bottom: The difference of the two spectra in the top panel, showing the isolated spectrum of the excess. The host spectrum has been re-scaled to ensure that the red edge is the same for both spectra.
Current usage metrics show cumulative count of Article Views (full-text article views including HTML views, PDF and ePub downloads, according to the available data) and Abstracts Views on Vision4Press platform.
Data correspond to usage on the plateform after 2015. The current usage metrics is available 48-96 hours after online publication and is updated daily on week days.
Initial download of the metrics may take a while.