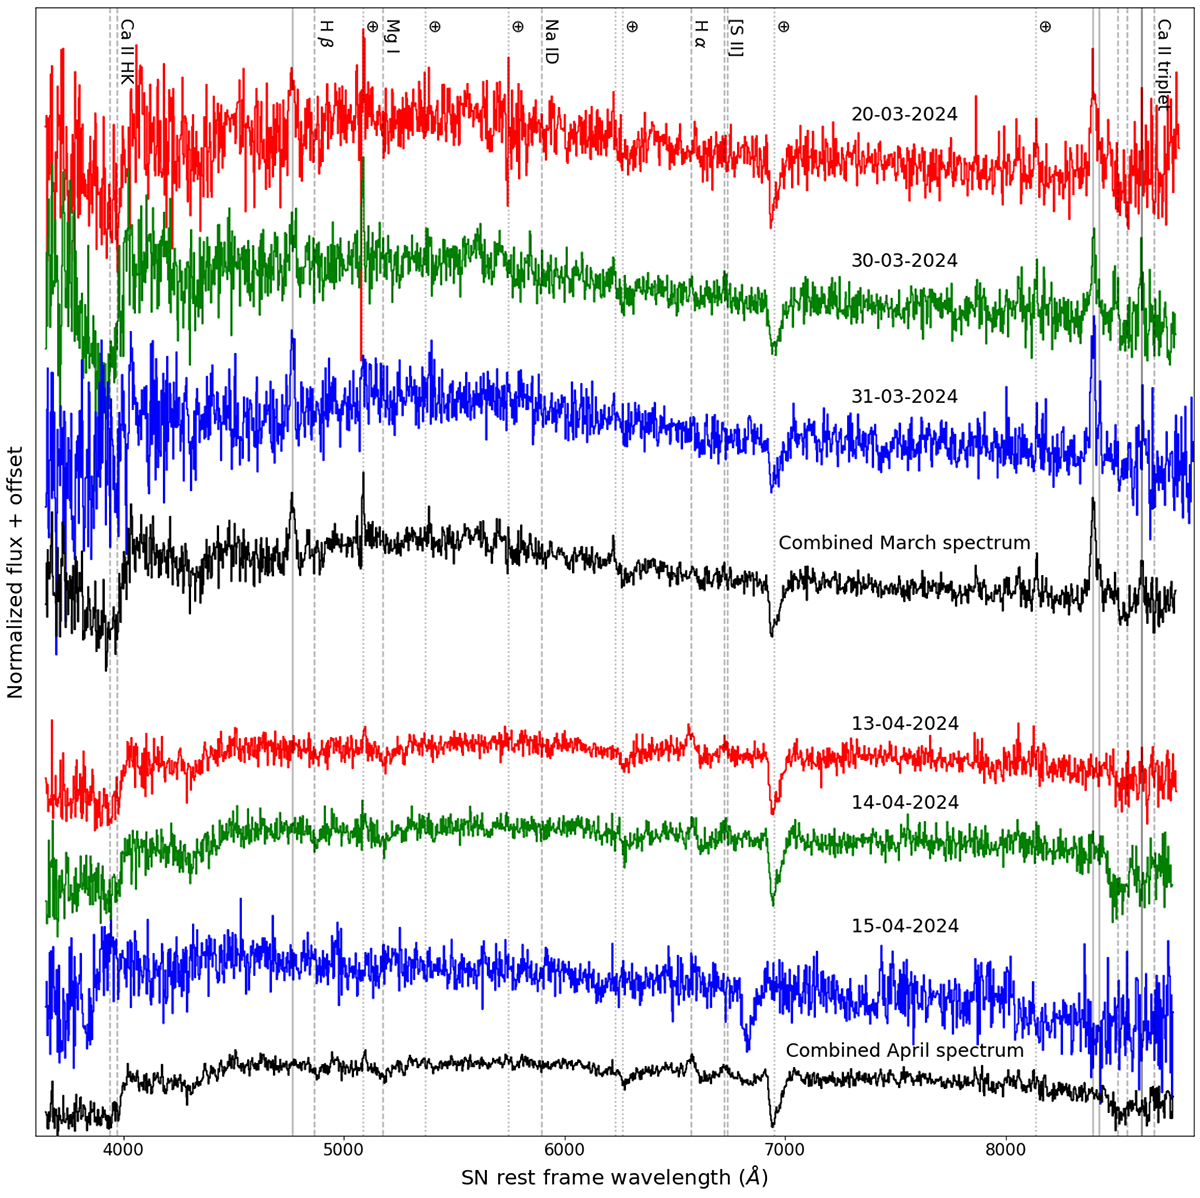
Fig. C.2.
Download original image
Individual late-time spectra of SN 2020qxz taken with NOT. For both the March and April spectrum the three individual epochs are shown in red, green, and blue, and the stacked spectrum is shown in black. Each individual spectrum has an exposure time of 3 × 20 minutes, except for the spectrum taken on 15-04-2024 which is 2 × 20 minutes. The transient emission lines are marked with gray vertical lines, the dashed vertical lines show the location of host galaxy lines (as well as Hβ to compare its location to the transient emission line) at the host redshift of z = 0.0975, and the dotted vertical lines show the location of sky lines.
Current usage metrics show cumulative count of Article Views (full-text article views including HTML views, PDF and ePub downloads, according to the available data) and Abstracts Views on Vision4Press platform.
Data correspond to usage on the plateform after 2015. The current usage metrics is available 48-96 hours after online publication and is updated daily on week days.
Initial download of the metrics may take a while.